

The Asimov Institute
The Asimov Institute · Other
The Asimov Institute is a Dutch AI research group behind the Neural Network Zoo, a free chart that maps dozens of neural network architectures with short explainers and paper links.
About The Asimov Institute
What Is The Asimov Institute
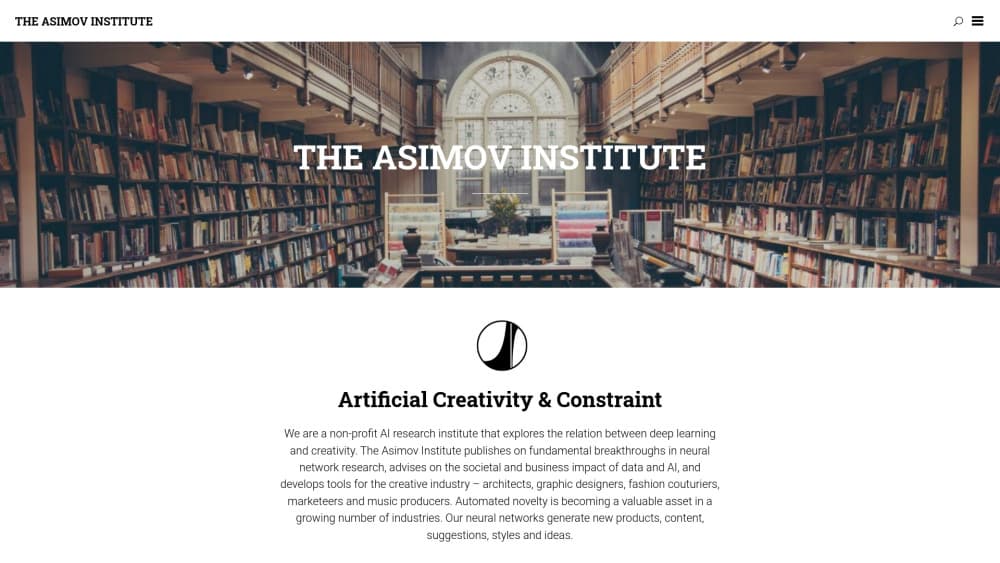
The Asimov Institute is a small research institute in the Netherlands that studies the link between deep learning and creativity. Its published work covers fundamental neural network research, advice on what data and AI mean for society and business, and tools built for people who make things: architects, graphic designers, fashion designers, marketers, and music producers.
The public face of that work is the Neural Network Zoo, a one page map of neural network architectures drawn by researcher Fjodor van Veen. Instead of listing definitions in alphabetical order, the chart draws each model as a node and arrow diagram, so an LSTM sits next to a GRU and a plain recurrent network and you can see they belong to the same family. Each entry comes with a short plain language note and a citation for the original paper.
What the institute is not matters just as much. There's no software to install, no account to create, and no API. It's a publication and a calling card for a research team, not a product with a roadmap. The team is small, output arrives in bursts, and the site has been quiet since the Inverse Surveillance AI hackathon in 2021 while the zoo itself was last redrawn in 2019.
Getting Started
- Open asimovinstitute.org in any browser. No signup, no cookie wall, no email form before you can read.
- Go to the Neural Network Zoo page and either read the chart inline or download the high resolution PNG for your own notes.
- Work through the architecture notes one at a time: feedforward networks, recurrent networks, convolutional networks, autoencoders, and generative adversarial networks. Each note ends with the source paper and a PDF link where one exists.
- If you want the chart on a wall, the site links to a print on demand poster. For research partnerships, advisory work, or press questions, write to [email protected].
Product Information
A quick look at The Asimov Institute's pricing, supported platforms, and performance.
Best for
The users, tasks, and scenarios where this tool fits best.
Users
- Students and self taught learners
- Researchers entering a new subfield
- Teachers and course authors
- Designers and studio leads
Tasks
- Getting the vocabulary straight
- Building a reading list
- Explaining a model to a non technical team
Scenarios
- A first week on a machine learning course
- A workshop or internal brown bag
- Early project research on generative design
Key features
The Neural Network Zoo Chart
One image covers dozens of architectures, from the perceptron and plain feedforward networks through convolutional, recurrent, and gated designs to autoencoders and generative adversarial networks. Drawing them as node maps does something a glossary can't: it shows lineage. Once you see that an LSTM and a GRU are both recurrent networks with different gates, the naming stops feeling arbitrary.
Plain Language Architecture Notes
Every entry in the chart has a short written note covering what the model does, how it learns, and where it tends to be used. The text avoids notation and explains the idea in a few sentences, which is enough to decide whether a model is worth a deeper read. Original papers are cited alongside, so the shallow version and the primary source sit in the same place.
Free High Resolution Download
The chart is offered as a direct PNG download with no account, no watermark, and no upsell in the way. That makes it practical for lecture slides, internal docs, or a printed reference sheet. A print on demand poster is linked for anyone who wants a physical copy rather than a file.
Inverse Surveillance AI
A research project that flips the usual direction of computer vision, pointing cameras and recognition systems at the people doing the watching instead of the public. The site hosts expert interviews, a write up of two working examples, and material from a 2021 hackathon. It's the clearest look at the institute's stance on power and data.
Creative Industry Tooling
The institute builds generative tools for architects, graphic designers, fashion couturiers, marketers, and music producers. The framing is automated novelty: models that propose new products, content, styles, and ideas rather than only classifying what already exists. Case studies on the site, including work on flight emissions at Schiphol Airport, show the research applied to real briefs.
Research and Advisory Work
Alongside public projects, the team publishes neural network research and advises organizations on the societal and business impact of data and AI. For a company weighing a generative feature, that combination of academic grounding and studio practice is the reason to get in touch, and the site lists the team and contact details in the open.
Pros and cons
Pros
- Everything public is free, including the high resolution chart, with no account and no email gate.
- The chart shows relationships between architectures, which a sorted list of definitions can't do.
- Each entry links to the original paper, so the resource works as a research entry point.
- Written in plain language, with jargon explained where it appears.
- The institute takes no vendor position, so the notes don't push a paid tool.
- Team members and contact details are published, which makes follow up easy.
Cons
- Output is sporadic. The chart was last revised in 2019 and the most recent public project is the 2021 hackathon, so don't expect a steady stream of updates.
- Only in English. There are no translations of the architecture notes.
- Coverage stops at the families that existed when the chart was drawn. Diffusion models, mixture of experts designs, and newer state space architectures have no dedicated entry, so the map is a foundation rather than a current survey.
- No API and no dataset. Anyone who needs machine readable model data or code has to look elsewhere.
- Advisory work has no published pricing or packages, so a commercial engagement starts with an email and a conversation.
Frequently asked questions
It's a research institute based in the Netherlands that works on deep learning and creativity. The team publishes neural network research, advises on the impact of AI and data, and builds generative tools for creative industries.
Related content
Explore related tools, skills, and articles for The Asimov Institute.
The Asimov Institute Alternatives

JarvisCore
Prescott Data · Coding · Productivity · OtherJarvisCore is an open source Python runtime where AI agents work as equal peers on an agent mesh, claim tasks from a shared ledger, and reach external services through a zero-trust broker.
Clef
Cloudflare · Business · OtherClef is Cloudflare's open-source decision model for Workers AI. It returns calibrated probabilities for typed questions, not generated text, so agents can classify, route, and act fast.

iFixAi
iFixAi · Business · OtheriFixAi is an open-source auditor for AI agents. It runs your agent through a simulation of your business, grades every reply, and returns an A to F scorecard backed by evidence.