

Bird Flu Risk Dashboard
Goodheart Labs (Nathan Young) · Business
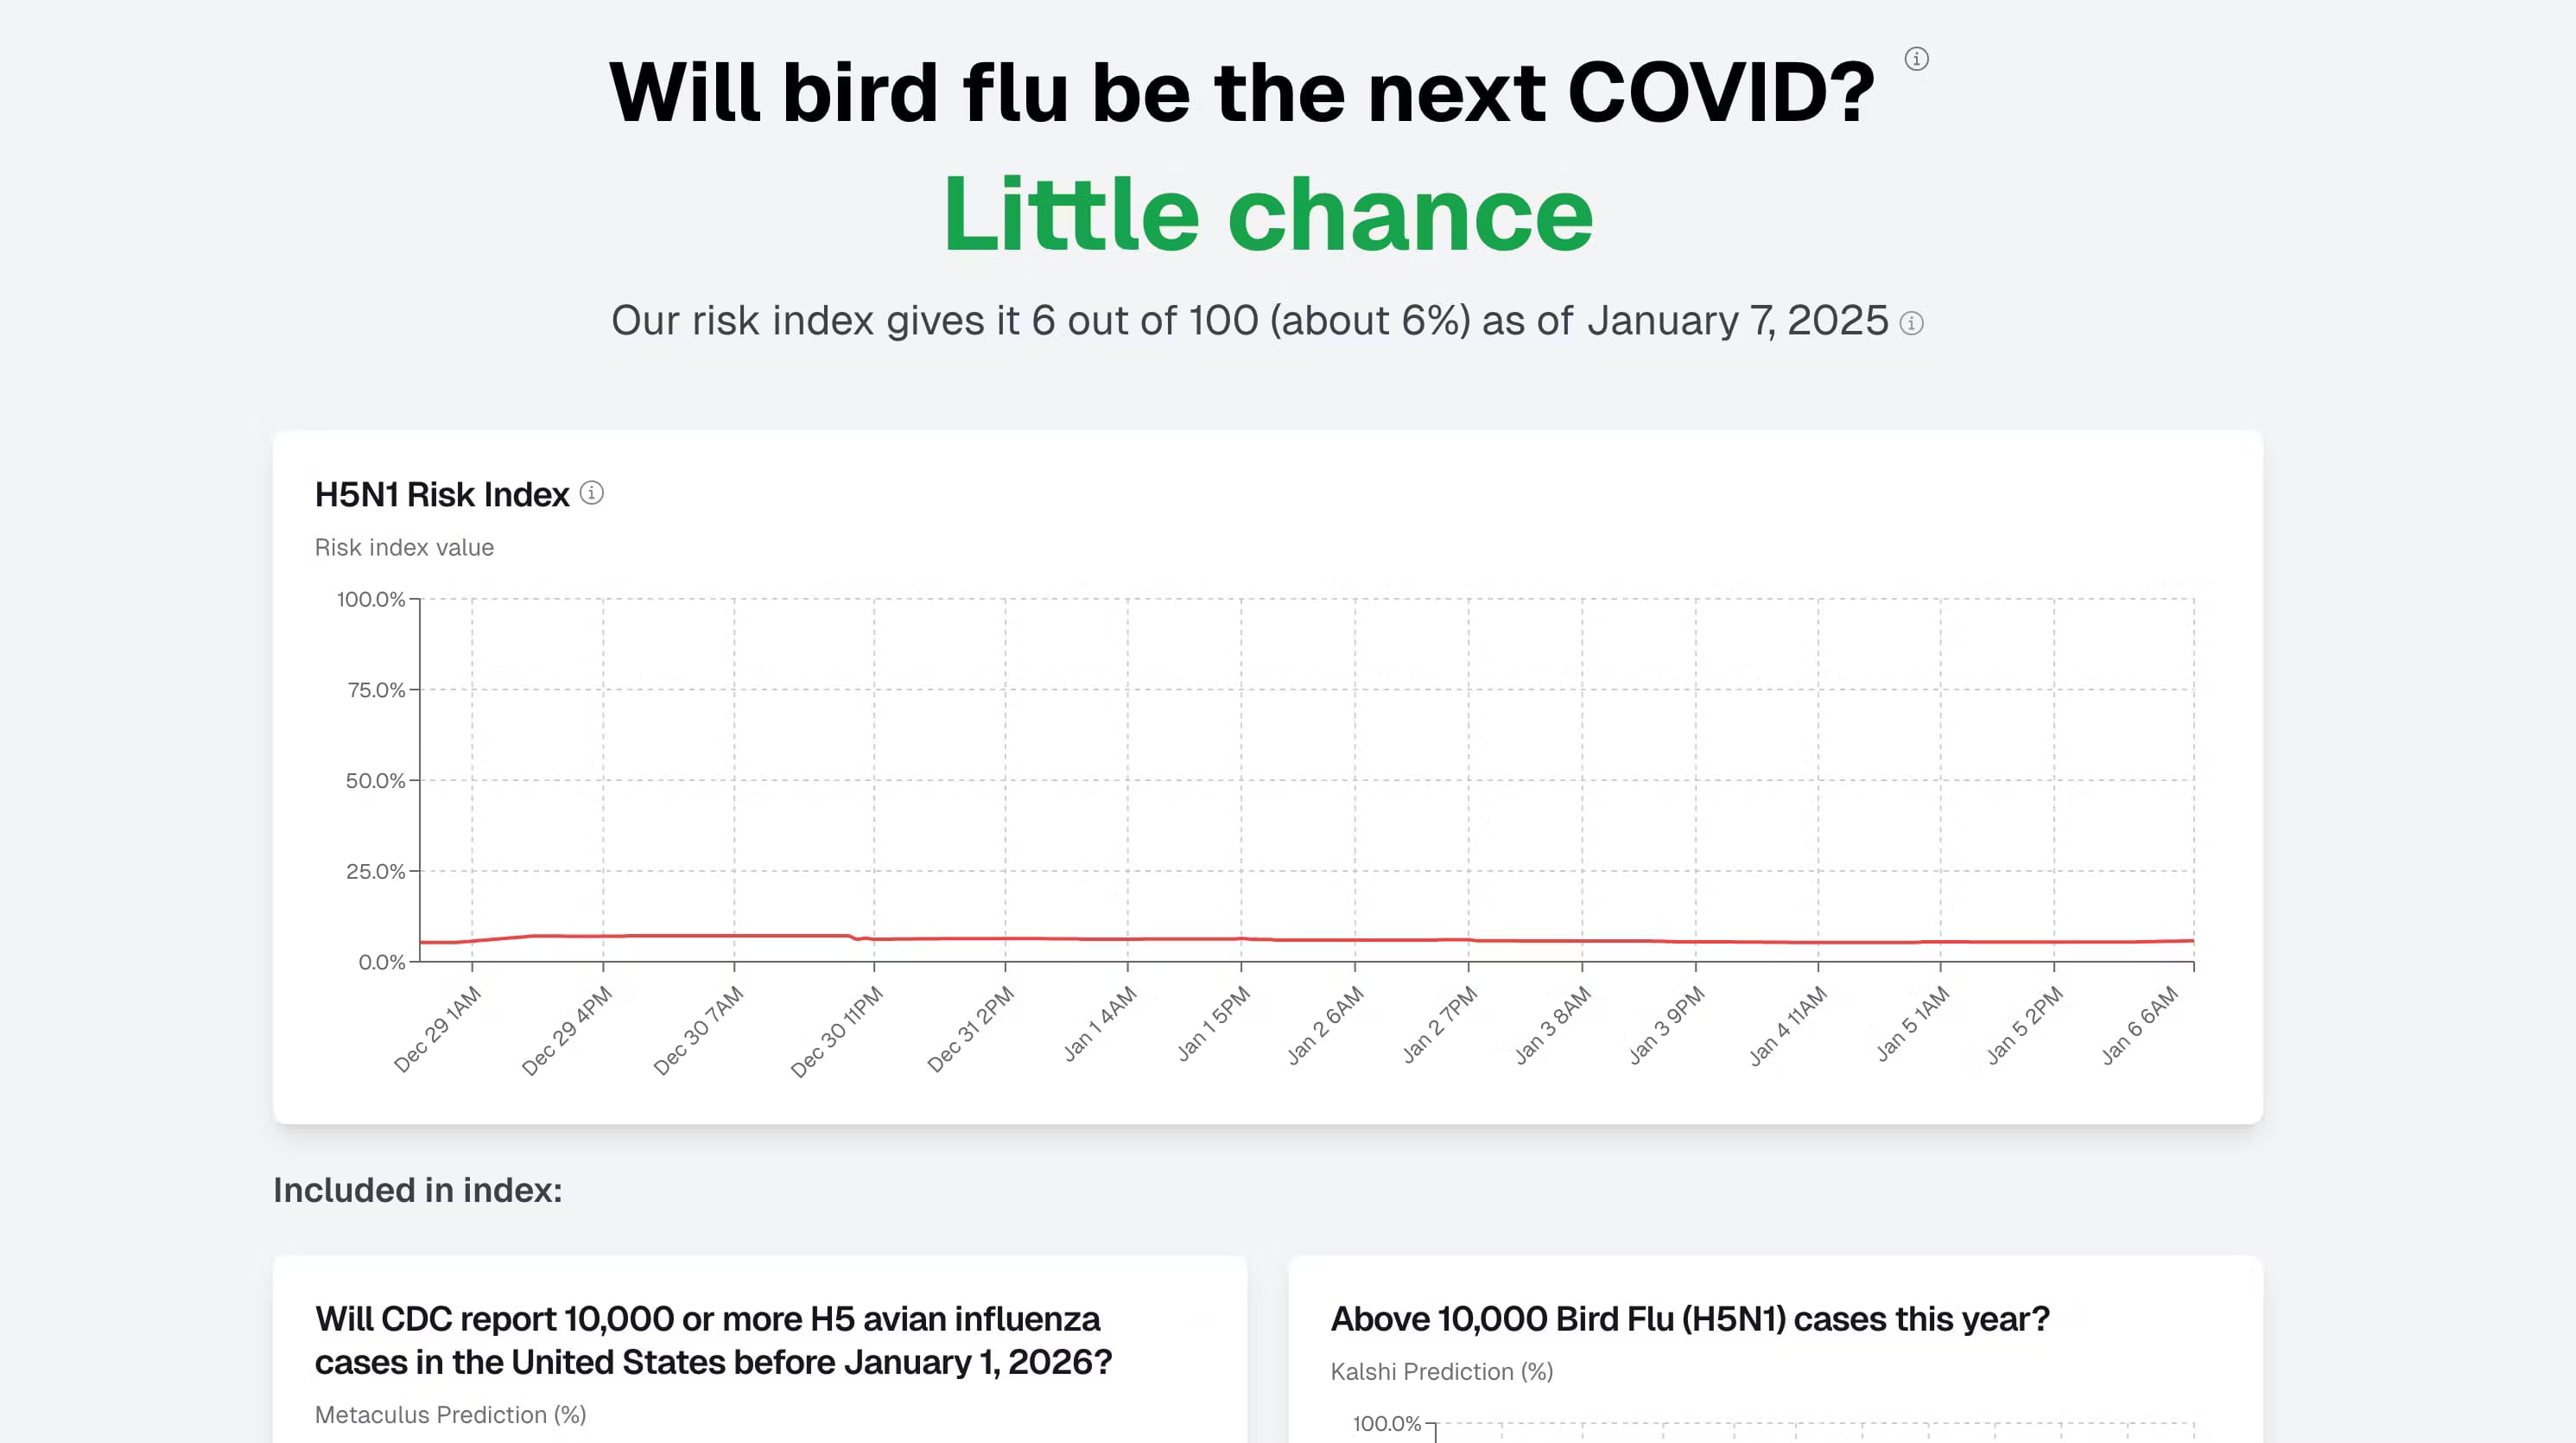
Bird Flu Risk Dashboard is a free, open source site that tracks H5N1 risk in real time, blending forecasting sites, prediction markets and CDC data into one risk index.
About Bird Flu Risk Dashboard
What Is Bird Flu Risk Dashboard
Bird Flu Risk Dashboard is a web tool built by the forecaster Nathan Young and released through Goodheart Labs. It answers one narrow question: how worried should you be that H5N1 bird flu turns into the next COVID-scale event? As a bird flu tracker, it works differently from a case-count feed. Instead of reporting raw totals, it pulls numbers from forecasters and prediction markets and combines them into a single risk index you can read at a glance.
The site went live in 2025 and runs as an open source Next.js project, so anyone can inspect how the score is built. It lists its sources plainly: Metaculus, a forecasting community, plus Kalshi and Polymarket, two real-money prediction markets, with CDC case data as an extra indicator. The idea is to give decision makers and curious readers a fast read on whether costly action is warranted.
The limits matter as much as the features. The index leans on markets and the maker's own judgement about how each signal connects to a bad outcome, so it's an opinionated model rather than a lab result. It primarily tracks human H5 cases and policy signals, not bird infections, and it's tied to United States data. If your question is about poultry or wild birds, this isn't the dashboard for that.
Getting Started
- Open birdflurisk.com in any browser; no account is needed to read the index
- Check the H5N1 risk index at the top to see the combined probability across all sources
- Scroll down to compare each source on its own, including Metaculus and Kalshi predictions and CDC case numbers
- Read the FAQ to see how the weights and conditional probabilities were set
- Subscribe with an email if you want a note when risk levels change significantly
Product Information
A quick look at Bird Flu Risk Dashboard's pricing, supported platforms, and performance.
Best for
The users, tasks, and scenarios where this tool fits best.
Users
- Forecasters and prediction market traders
- Public health and policy watchers
- Journalists and researchers
- Curious general readers
Tasks
- Reading the combined risk index
- Comparing individual sources
- Tracking the 10,000-case question
- Watching the travel advisory signal
- Reviewing the method
Scenarios
- You run a forecasting desk and need a fast morning read on bird flu
- A news story claims bird flu risk is spiking
- You're briefing a team on pandemic readiness
- You want real time outbreak monitoring without sitting on the page all day
- You're skeptical of health dashboards
Key features
Composite H5N1 Risk Index
The headline number is a single index that averages predictions from several sources. It blends Metaculus forecasts with Kalshi and Polymarket market prices and scales each one by a fixed factor. You get one figure to watch instead of three, which is the whole point of the tool. The catch is that the blend is a judgement call, so the number reflects the maker's model as much as the underlying data.
Metaculus, Kalshi and Polymarket Feeds
The dashboard pulls live probabilities from Metaculus, a forecasting community with a public track record, and from Kalshi and Polymarket, two real-money prediction markets. Each source gets its own row so you can see the spread between them. When the market and the forecaster disagree, that gap is often the most useful signal on the page. Data refreshes on a short cache, so you're looking at recent numbers rather than a stale snapshot.
CDC Case and Advisory Tracking
Alongside the markets, the site tracks CDC H5 case reporting and the market on whether the agency will issue a travel advisory. That gives you a policy angle, not just a case count. The 10,000-case threshold gets its own market, which acts as a proxy for a large-scale outbreak. It's the piece that connects raw epidemiology to the questions people actually ask.
Transparent Methodology and Open Source Code
The full formula is published on the page, and the source code lives on GitHub. The FAQ walks through how conditional probabilities were assigned and admits where the maker guessed. For a risk tool, that openness is the difference between something you can cite and something you have to take on faith. Anyone can fork it, deploy their own version or add a data source.
Email Alerts on Big Changes
You can hand over an email address and get a note only when the risk level shifts significantly or when a comparable dashboard ships. It's meant to be low noise, not a daily digest. For people who don't want to keep a tab open all day, that's the practical way to stay current. The signup is optional and the site states the address isn't used for anything else.
Community Source Voting
A short poll lets visitors vote on which data sources should be added to the index next. It's a small feature, but it signals that the project is meant to grow with its readers rather than stay fixed. If you think a source is missing, that's the channel to push for it.
Pros and cons
Pros
- Free to use and fully open source, so you can read the method and the code behind every number
- Blends several independent sources, which holds up better than watching one market or one forecaster
- Shows each source on its own, so you can see where the forecasters and the markets disagree
- Email alerts cut the need to check the site constantly, firing only when the picture changes
- Plain-language FAQ explains the formula and the assumptions in a few short paragraphs
Cons
- The index depends on the maker's own judgement for the conditional probabilities, so it's an opinionated model, not an official assessment
- It centers on human H5 cases and CDC policy signals, so it won't help if you're tracking infections in poultry or wild birds
- Coverage is limited to United States data, which leaves out outbreaks reported elsewhere
- There's no public API, so you can't pull the index into your own tools or automate it
- It's a small volunteer project, so new sources and features move at the pace of one maintainer
Frequently asked questions
Bird Flu Risk Dashboard is a free web tool that tracks H5N1 bird flu risk. It combines forecasts from Metaculus with prices from the Kalshi and Polymarket prediction markets and layers in CDC case data, then averages them into one risk index you can read at a glance.
Related content
Explore related tools, skills, and articles for Bird Flu Risk Dashboard.
Bird Flu Risk Dashboard Alternatives

Knocket
Knocket (Tencent RTC team) · Productivity · Business · ChatbotKnocket is a free live chat and contact page tool that lets visitors message you from your website, app, or a shareable link, with every reply handled from Telegram or one inbox.

shippedit.me
Krawlup · Marketing · Businessshippedit.me now redirects to Krawlup, a web platform that audits SEO, AEO and page speed every week, then hands the fixes to AI coding agents over MCP.

Ayven
Alknoma · Productivity · BusinessAyven is an AI control centre by Alknoma that turns a plain-language goal into a dated plan, hands the work to your people and AI agents, and asks for your approval only when the call is yours.