

Data-Driven Shopify Insights
Unsupervised LLC · Marketing
By the Numbers is a Shopify analytics app that pairs reports on sales, orders, and margins with an AI analyst, loyalty groups, and segment sync to your email and ad platforms.
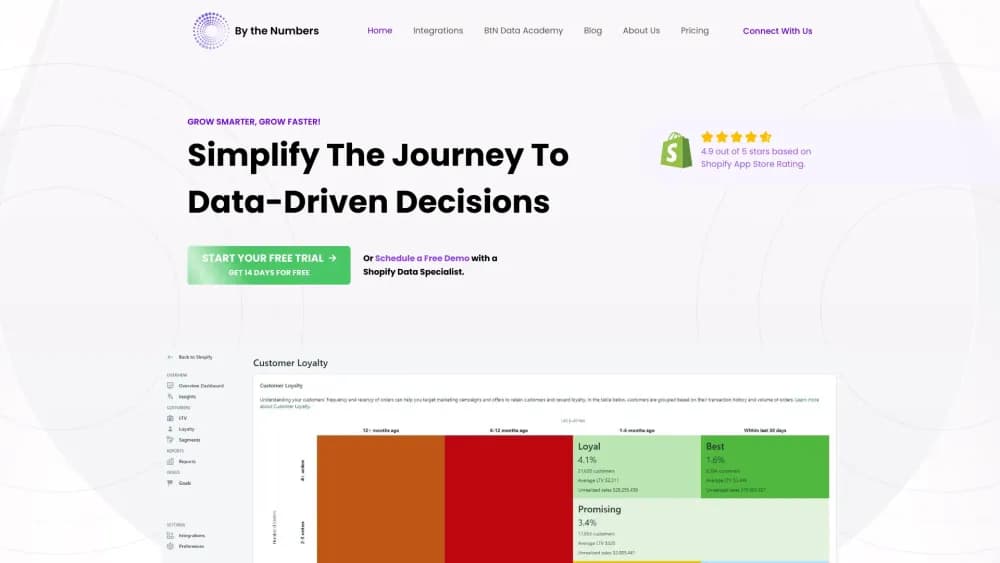
About Data-Driven Shopify Insights
What Is By the Numbers
By the Numbers is a Shopify app for store owners who want the numbers explained instead of just displayed. It installs from the Shopify App Store, imports the full order history in the background, and builds its reports from that data rather than from browser tracking.
The product covers four jobs that Shopify's own analytics doesn't handle well on its own. It writes a weekly briefing in plain English. It sorts customers into RFM loyalty groups by recency and frequency. It pushes those groups into the email and ad platforms you already use. And it sends server-side conversion events to Meta, Google, TikTok, and Reddit so the ad platforms see purchases that browser pixels miss.
The main catch is scope: it works inside Shopify and only reads Shopify orders. Stores on another platform have no path in, and the Copper chat comes with a monthly message allowance that tops out at 600 on the largest plan.
Getting Started
- Install the app from the Shopify App Store and approve the data access it asks for.
- Let the order history backfill overnight. No CSV upload or setup call is involved.
- Set the business profile: category, monthly goal, and the focus area for the next quarter.
- Connect the platforms you advertise on, such as Klaviyo, Meta, Google Ads, TikTok, or Reddit Ads.
- Wait for the first Pulse email on Monday, then ask Copper a follow-up question in the app.
Product Information
A quick look at Data-Driven Shopify Insights's pricing, supported platforms, and performance.
Best for
The users, tasks, and scenarios where this tool fits best.
Users
- DTC brand founders running their own numbers
- Retention and CRM marketers
- Lean growth teams without a data analyst
- Shopify Plus merchants with high order volume
Tasks
- Reading a week of sales in plain English
- Building win-back audiences
- Comparing your store with peers
- Recovering lost conversions
- Setting a monthly target and tracking it
Scenarios
- Monday morning planning
- A slow month with a hole to close
- A discount campaign that has lost its edge
Key features
Copper, an Analyst That Reads Your Store
Copper answers questions about sales, profit, products, customers, cohorts, ads, and inventory, and it starts from your orders, margins, and connected ad platforms rather than from the question alone. It returns charts and tables you can copy or download as Markdown. Its benchmark panel places your AOV, margin, retention, and refund rate next to the median store in your category, revenue band, and country, which answers the question store owners ask most: is this number good?
Pulse Weekly Briefing
At the start of every week, a Monday email summarises the headline numbers against the previous period, names the unusual days, and explains what drove them. Up to three next steps follow, each linked to the page in the app where you'd act on it. It also arrives when something meaningful changes mid week, so a sudden drop doesn't wait until Monday.
RFM Loyalty Matrix
A 12-cell grid sorts every customer by recency and frequency, which makes this RFM analysis a form of Shopify customer segmentation that needs no spreadsheet. The cells roll into seven named groups: Best, Loyal, Promising, Recent, Defecting, At risk, and Dormant. Each group carries customer count, AOV, LTV, and total sales. Cutoffs and group names are editable, with presets and suggested cutoffs drawn from your own order history. The matrix rescores on a regular schedule, so a customer who slips from Loyal to At risk shows up in the group without manual work.
Segment Sync to Email and Ad Platforms
Over 75 filters span orders, products, lifetime value, recency, and discount usage, and they combine with AND, OR, and NOT logic without SQL. Thirty or so segments come ready made. Any segment syncs through direct platform APIs to Klaviyo, Mailchimp, Attentive, Meta, Google Ads, TikTok, and Reddit Ads, then refreshes on its own instead of waiting for a Monday CSV upload.
das Pixel Server-Side Tracking
Server-side tracking for Shopify goes to Meta CAPI, Google Enhanced Conversions, TikTok Events API, and Reddit from one payload, with hashed customer identifiers and consent checks. Deduplication on event ID stops the browser pixel and the server event from counting the same purchase twice. A dead-letter queue holds failed events for retry when a platform API goes down, so a conversion isn't lost to an outage. The vendor puts the recovery at 20 to 40% of conversions that browser-only tracking would miss.
Forecasting and Goal Tracking
Shopify sales forecasting fits a statistical model to daily sales and separates the trend from weekly and yearly seasonality, drawing from up to 25 months of history. It needs at least 90 days with orders. You can set a goal as a fixed amount or as growth over the previous period or last year, scope a forecast to a saved segment, and pin named forecasts to a dashboard. Every time you open one, it refits on orders through yesterday.
Pros and cons
Pros
- Everything sits on one plan: reports, RFM, cohorts, forecasting, segment sync, and server-side tracking, with every feature included from the $19 Starter tier up.
- Server-side tracking comes at no separate charge, while standalone trackers like Elevar start around $225/mo. The Klaviyo path uses the same order data as every report, so the two figures line up.
- Copper works from store data and peer benchmarks, so its answers read like an analyst's write-up instead of a generic chatbot reply.
- Segments refresh on their own after the first sync, which removes the weekly export and re-upload loop.
- The 14 day trial needs no credit card, and skipping a plan at the end bills nothing.
Cons
- Order volume drives the bill: Starter caps at 100 orders a month, Growth at 500, and Pro at 3,000, so a store that scales fast moves up a plan quickly.
- Copper messages are metered, from 50 a month on Starter to 600 on Unlimited, and chat questions compete with report insights for the same allowance.
- It reads Shopify data only, so a brand selling on multiple platforms needs a second analytics tool for the rest.
- Native integrations stop at Klaviyo, Mailchimp, Attentive, Meta, Google Ads, TikTok, and Reddit Ads, and there's no published public API for custom pipelines.
Frequently asked questions
It reports on sales, products, customers, and margins, then adds an AI analyst, a weekly email briefing, loyalty groups, segment sync, forecasting, and server-side conversion tracking. The idea is to turn store data into actions rather than another dashboard to check.
Related content
Explore related tools, skills, and articles for Data-Driven Shopify Insights.
Data-Driven Shopify Insights Alternatives

ngram 2.0
ngram · Video · Marketingngram 2.0 is an AI video generator for teams. It turns a prompt, a screen recording, or a product URL into a narrated explainer, product demo, or AI avatar video, and every scene stays editable.

shippedit.me
Krawlup · Marketing · Businessshippedit.me now redirects to Krawlup, a web platform that audits SEO, AEO and page speed every week, then hands the fixes to AI coding agents over MCP.

MePersona
MePersona, Inc. · Writing · Productivity · MarketingMePersona is an AI unified inbox for creators. It learns your voice, drafts replies to fan messages from 12 platforms, and sends only what you approve.