
Connected Papers
Connected Papers · Writing · Business
Connected Papers is a visual tool that turns one academic paper into a graph of related work. Researchers use it to map a new field, spot important papers, and find prior and derivative works worth citing.
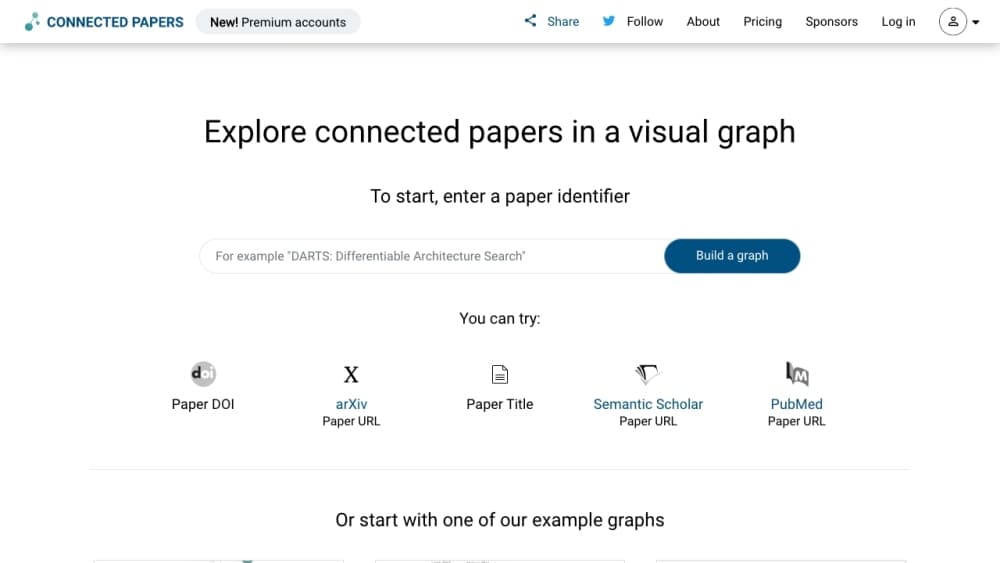
About Connected Papers
What Is Connected Papers
Connected Papers is a browser based research tool that builds a visual graph of academic papers related to a single starting paper you pick. You enter a title, DOI, or a link, and it lays out dozens of related papers as connected nodes. The point is to see the shape of a field at a glance instead of scrolling through list after list of search results.
It pulls from the Semantic Scholar paper corpus, which covers hundreds of millions of papers across scientific fields. The layout is driven by similarity, not by citation order, so two papers that never cite each other can still sit close together when they share the same references and the papers that cite them. Node size reflects how often a paper is cited, and the color reflects the year it was published, so older foundational work and fresh papers stand apart visually.
The catch is scope. Connected Papers is a discovery map, not a full text reader, so you still open papers elsewhere to read them. The free plan also caps you at 5 graphs per month, and very new or thinly cited papers sometimes have too few connections to produce a graph at all.
Getting Started
- Go to connectedpapers.com and enter a paper title, DOI, PubMed ID, or a link to a paper.
- Pick the paper you meant from the search results and let the graph build.
- Read the graph: bigger nodes are cited more, and tighter clusters are more similar to each other.
- Open the Prior Works and Derivative Works views to see the roots of the field and the papers that came after it.
Product Information
A quick look at Connected Papers's pricing, supported platforms, and performance.
Best for
The users, tasks, and scenarios where this tool fits best.
Users
- Graduate students
- Researchers and applied scientists
- Thesis and dissertation writers
- Lab and department teams
Tasks
- Mapping a new field
- Finding prior works
- Finding derivative works
- Filling bibliography gaps
Scenarios
- Starting a literature review on a deadline
- Checking for missed papers before submission
- Onboarding into a new lab topic
- Supporting students at scale
Key features
Similarity Graphs
The core of the product is a graph built from one starting paper and dozens of related ones. Papers are arranged by similarity rather than by citation order, so the map groups work that shares references and citing papers, even when those papers never reference each other directly.
Prior Works View
This view pulls out the papers that the graph's papers most often cite. It points to the foundational and ancestor work in a field, which is exactly what you want when you are tracing where an idea came from before you build on it.
Derivative Works View
The opposite angle surfaces papers that cite many of the papers in the graph. It highlights follow up studies and reviews, so you can see how a field moved on and who picked up the thread.
Multi-Origin Graphs
You can build a graph from more than one starting paper at once. That helps when a topic is defined by two or three landmark papers, since the combined graph shows the shared neighborhood around all of them.
Saved Papers and Graph History
You can save papers into a list and revisit the graphs you have built. The history and saved lists export as BibTeX files, which drop straight into reference managers like Zotero, Mendeley, or EndNote.
Node and Layout Encoding
Every node is a paper, its size tracks the citation count, and its color tracks the publishing year. Strong linking lines and tight clusters mark papers that are closely related, so you can read age and influence without opening a single abstract.
Pros and cons
Pros
- Turns a vague sense of a field into a concrete visual map, which speeds up the first pass of a literature review.
- The similarity approach surfaces papers that a plain citation tree would miss, including work that never cites your starting paper.
- Free plan includes every feature, not a cut down version, and allows 5 graphs a month.
- Saved papers and graph history export to BibTeX, so results move straight into the reference manager you already use.
- Backed by the Semantic Scholar corpus, which covers hundreds of millions of papers across the sciences.
Cons
- It is a discovery tool, not a reader, so you still need another tab to open and read each paper.
- The free plan caps at 5 graphs a month, which runs out fast during a serious literature review.
- Very recent or lightly cited papers may not have enough connections to build a graph, which is a real gap when you work at the edge of a field.
Frequently asked questions
Connected Papers is used to explore academic literature visually. You give it one paper, and it builds a graph of related papers so you can understand a field, find prior and derivative works, and spot papers you might have missed.
Related content
Explore related tools, skills, and articles for Connected Papers.
Connected Papers Alternatives

Google EmbeddingGemma 2
Google DeepMind · Writing · Image · CodingGoogle EmbeddingGemma 2 is a 740M-parameter open model that turns text, code, images, audio, and video frames into vectors in one 768-dimension space, running on phones and laptops.

MePersona
MePersona, Inc. · Writing · Productivity · MarketingMePersona is an AI unified inbox for creators. It learns your voice, drafts replies to fan messages from 12 platforms, and sends only what you approve.

Fluence
Yay Software (Yannick Huchard) · Writing · Voice & Language · ProductivityFluence is an Android app that reads PDFs, EPUBs, Word files and web articles aloud, follows each sentence as it speaks, and answers questions about the text on the phone itself.