

Dash0
Dash0 · Coding
Dash0 is an OpenTelemetry-native observability platform for metrics, logs, and traces. It adds AI-driven incident detection and usage-based pricing without vendor lock-in.
About Dash0
What Is Dash0
Dash0 is an observability platform built from the ground up on OpenTelemetry. It collects metrics, logs, and traces from your applications and infrastructure, then lets you query them with PromQL and SQL from one place. The company behind it is Dash0, founded in Germany in 2023 and now headquartered in New York. It raised $110M in Series B funding at a $1B valuation and counts Zalando, Taco Bell, and The Telegraph among its 800+ customers.
The promise is that you send standard OpenTelemetry data, keep the metadata that matters, and avoid both a proprietary agent and per-seat pricing. It also folds in newer AI features: Agent0 watches for services that are degrading without alert coverage and can draft a fix as a pull request, while Darkplane tracks how AI coding assistants such as Claude Code and Cursor are used across a team.
Where it fits best is with engineering, SRE, and platform teams already invested in OpenTelemetry. If you run the OpenTelemetry Collector and want a backend that speaks the same standard, Dash0 meets you there. The main limit is that the platform assumes you have telemetry instrumented in the first place. Teams without OTel pipelines need to set that up before Dash0 becomes useful. Its AI features are also newer and still maturing, so treat them as an addition to observability rather than a replacement for an on-call engineer.
Getting Started
- Start a 14-day free trial at dash0.com with no credit card required, or book a demo for a sales-led walkthrough.
- Point your existing OpenTelemetry Collector or SDK at your Dash0 endpoint, since no proprietary agent or gateway tier is required.
- Use SignalControl to filter noise, convert high-volume signals into compact metrics, and sample traces before they are stored.
- Explore services, infrastructure, Kubernetes, logs, and traces in the dashboard, or query the same data with PromQL and SQL.
- Set alert rules and budget limits, then optionally enable Agent0 to scan for gaps and Darkplane to track AI coding tool usage.
Product Information
A quick look at Dash0's pricing, supported platforms, and performance.
Best for
The users, tasks, and scenarios where this tool fits best.
Users
- SRE and platform teams
- Engineering leaders
- Teams already on OpenTelemetry
Tasks
- Correlating a slow request
- Reducing telemetry volume
- Tracking AI coding tools
Scenarios
- Investigating a production incident
- Monitoring Kubernetes
- Keeping an eye on cost
Key features
OpenTelemetry-native data collection
Dash0 is built around OpenTelemetry rather than a proprietary format, so you connect the Collector and SDKs you already use. That means no vendor agent to install and no lock-in on how your data is structured. If you later want to move, you export the same standard signals without losing context.
SignalControl pipeline
SignalControl sits in front of storage and shapes your data before you pay for it. It filters out noise, turns high-volume signals into compact metrics, samples traces, and rolls up high-cardinality time series. The goal is straightforward: keep the observability you rely on while cutting the volume that drives cost, and pay only for the telemetry you actually keep.
Unified metrics, logs, and traces
Metrics, logs, and traces land in one store instead of three separate tools, so you can move between them in a single workflow. Start from a metric that looks off, open the related traces for your distributed tracing view, then read the logs for the same trace ID. Keeping everything correlated is what shortens the time between noticing a problem and understanding it.
PromQL, SQL, and open query interfaces
You query Dash0 with PromQL and SQL, the languages many engineers already know, rather than a bespoke query language. The same store is reachable through an MCP server, a CLI, and an API, which means your AI agents can read the same data your team does. Open interfaces matter here because they keep both humans and tools working against one source of truth.
Agent0 AI SRE
Agent0 is an AI SRE that scans your environment continuously. According to Dash0, it surfaces services that are degrading with no alert coverage, traces issues back to the offending commit, and drafts a fix as a pull request. With Automations, that loop can run without anyone opening a chat. It is meant to catch what your alert rules miss, not to replace them.
Dash0 operator and CLI
For Kubernetes teams, the dash0-operator automates instrumentation and manages observability inside a cluster. A dash0-cli brings the platform to the terminal, and a Terraform provider plus Configuration as Code let you manage dashboards, check rules, and other resources through your existing release pipeline instead of clicking through a UI.
Pros and cons
Pros
- No vendor lock-in: built on OpenTelemetry and open standards, so your instrumentation and data export stay portable.
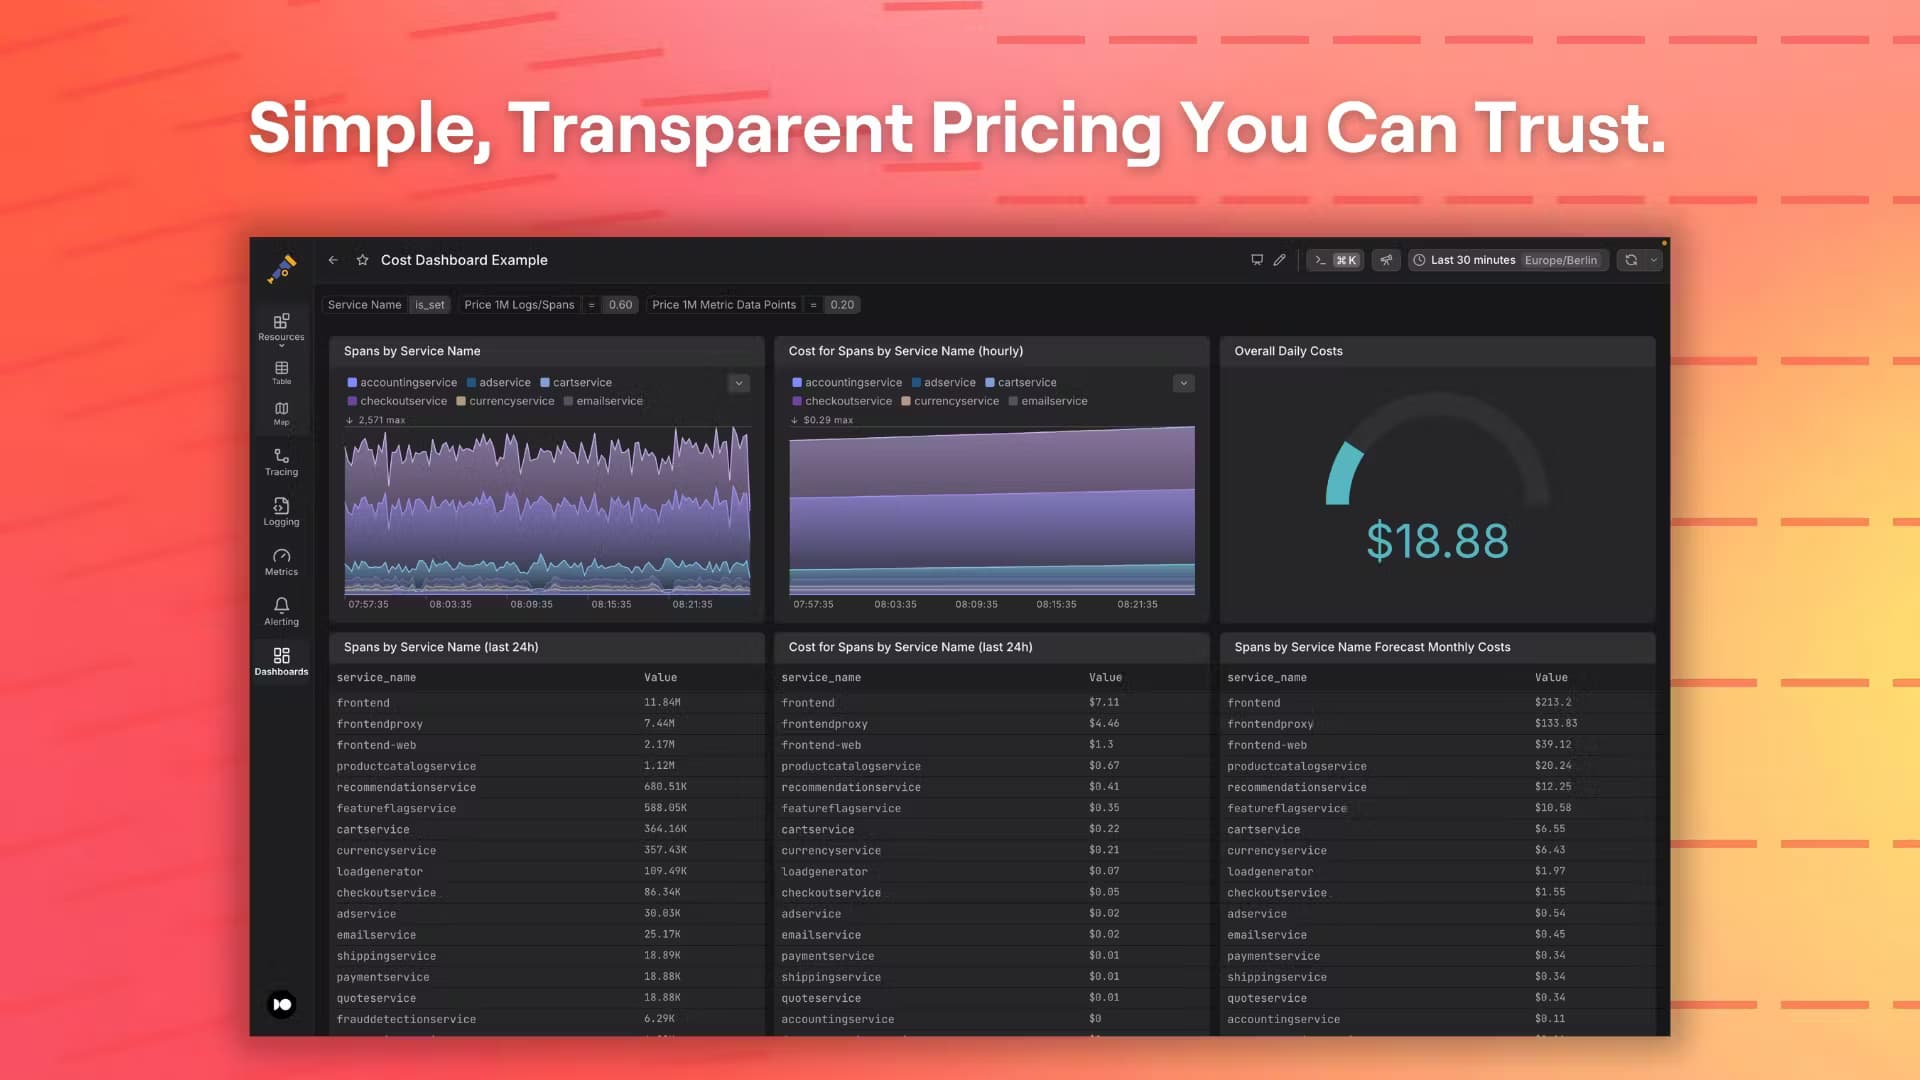
- Transparent, usage-based pricing: you pay per signal sent and stored, not per seat or per byte, with budget limits and a forecast built in.
- One store for every signal: metrics, logs, and traces live together, which makes correlation faster than stitching three tools together.
- AI features on the same data: Agent0 and Darkplane query the same signals and context as your team, not a separate silo.
- Developer-focused workflow: keyboard navigation, Configuration as Code, and a Terraform provider fit how engineering teams already work.
Cons
- Assumes you instrument with OpenTelemetry: if you do not run OTel pipelines yet, setup work comes before any payoff.
- Consumption pricing needs watching: because you pay per signal, a noisy service can raise costs unless you tune SignalControl and budget limits.
- AI features are still maturing: Agent0 and Darkplane are newer additions, so results vary and they are not a substitute for an on-call engineer.
- Competitive market: Dash0 competes with larger, longer-established observability vendors, so switching decisions carry the usual migration effort.
Frequently asked questions
Dash0 is used to collect, store, and analyze observability data. It ingests metrics, logs, and traces over OpenTelemetry and gives engineering teams one place to monitor services, correlate signals, and respond to incidents.
Related content
Explore related tools, skills, and articles for Dash0.
Dash0 Alternatives

Base Code
Base44 (Wix) · Coding · ProductivityBase Code is a shared cloud development environment from Base44. Teammates describe changes to an existing GitHub codebase in chat, preview them live and send them back as pull requests.

Google EmbeddingGemma 2
Google DeepMind · Writing · Image · CodingGoogle EmbeddingGemma 2 is a 740M-parameter open model that turns text, code, images, audio, and video frames into vectors in one 768-dimension space, running on phones and laptops.

GitGlow
GitGlow · Coding · ProductivityGitGlow is a local-first desktop Git client that lets independent developers review their own code and their AI agents' changes in one place before shipping.