

Dashbreeze
Dashbreeze · Coding
Dashbreeze is an AI business analytics dashboard that lets you connect your data, ask plain-language questions, and share live, no-code dashboards with your team.
About Dashbreeze
What Is Dashbreeze
Dashbreeze is a no-code dashboard builder built around conversation, not formulas. You connect the tools your business already runs on, then ask questions in plain English and get answers backed by charts, tables, and metrics. It targets people who need real reporting but don't want to learn a BI stack.
The pitch is simple. Your data has a story, and most dashboards make you dig for it. Dashbreeze flips that. You ask what changed, why it happened, or how this month compares to last, and the tool analyzes the underlying records and explains what it finds. Every answer can become a follow-up question, so one line of inquiry can run as deep as you need.
The catch is what it doesn't do. Dashbreeze leans on connected sources and auto-refresh intervals rather than a live streaming pipeline. The fastest refresh you can get is every 10 minutes on the top plan. Need real-time monitoring? This isn't it. It's built for reporting and analysis, not for watching a live system.
Getting Started
- Sign up and open a workspace, then connect a data source like Google Sheets, Airtable, or Notion on the free plan.
- Prepare the data inside Dashbreeze: filter columns, fix types, rename fields, and combine related tables.
- Ask your first business question in plain language and follow the conversation with more questions.
- Turn the answers into a dashboard, then share it with a public link, a password, or a private email invitation.
Product Information
A quick look at Dashbreeze's pricing, supported platforms, and performance.
Best for
The users, tasks, and scenarios where this tool fits best.
Users
- Small business owners who track sales, marketing, and finance in spreadsheets
- Startup founders building recurring reports
- Operations managers who want their team on shared numbers
Tasks
- Answering "what changed this month" questions from your own data
- Replacing a static spreadsheet export with a live report
- Cleaning messy source data before analysis
Scenarios
- Weekly client reporting for a small agency
- Monthly business reviews where you compare periods
- Embedding a live view into another site or app
Key features
Conversational Analytics
You ask questions about your data the way you'd ask a colleague, and this AI dashboard tool analyzes the underlying records and answers in plain language. Follow-up questions keep the same thread going, so you don't restart the analysis each time you want to dig deeper. When words aren't enough, it pulls in charts, tables, and metrics to make the answer clearer.
No-Code Dashboard Builder
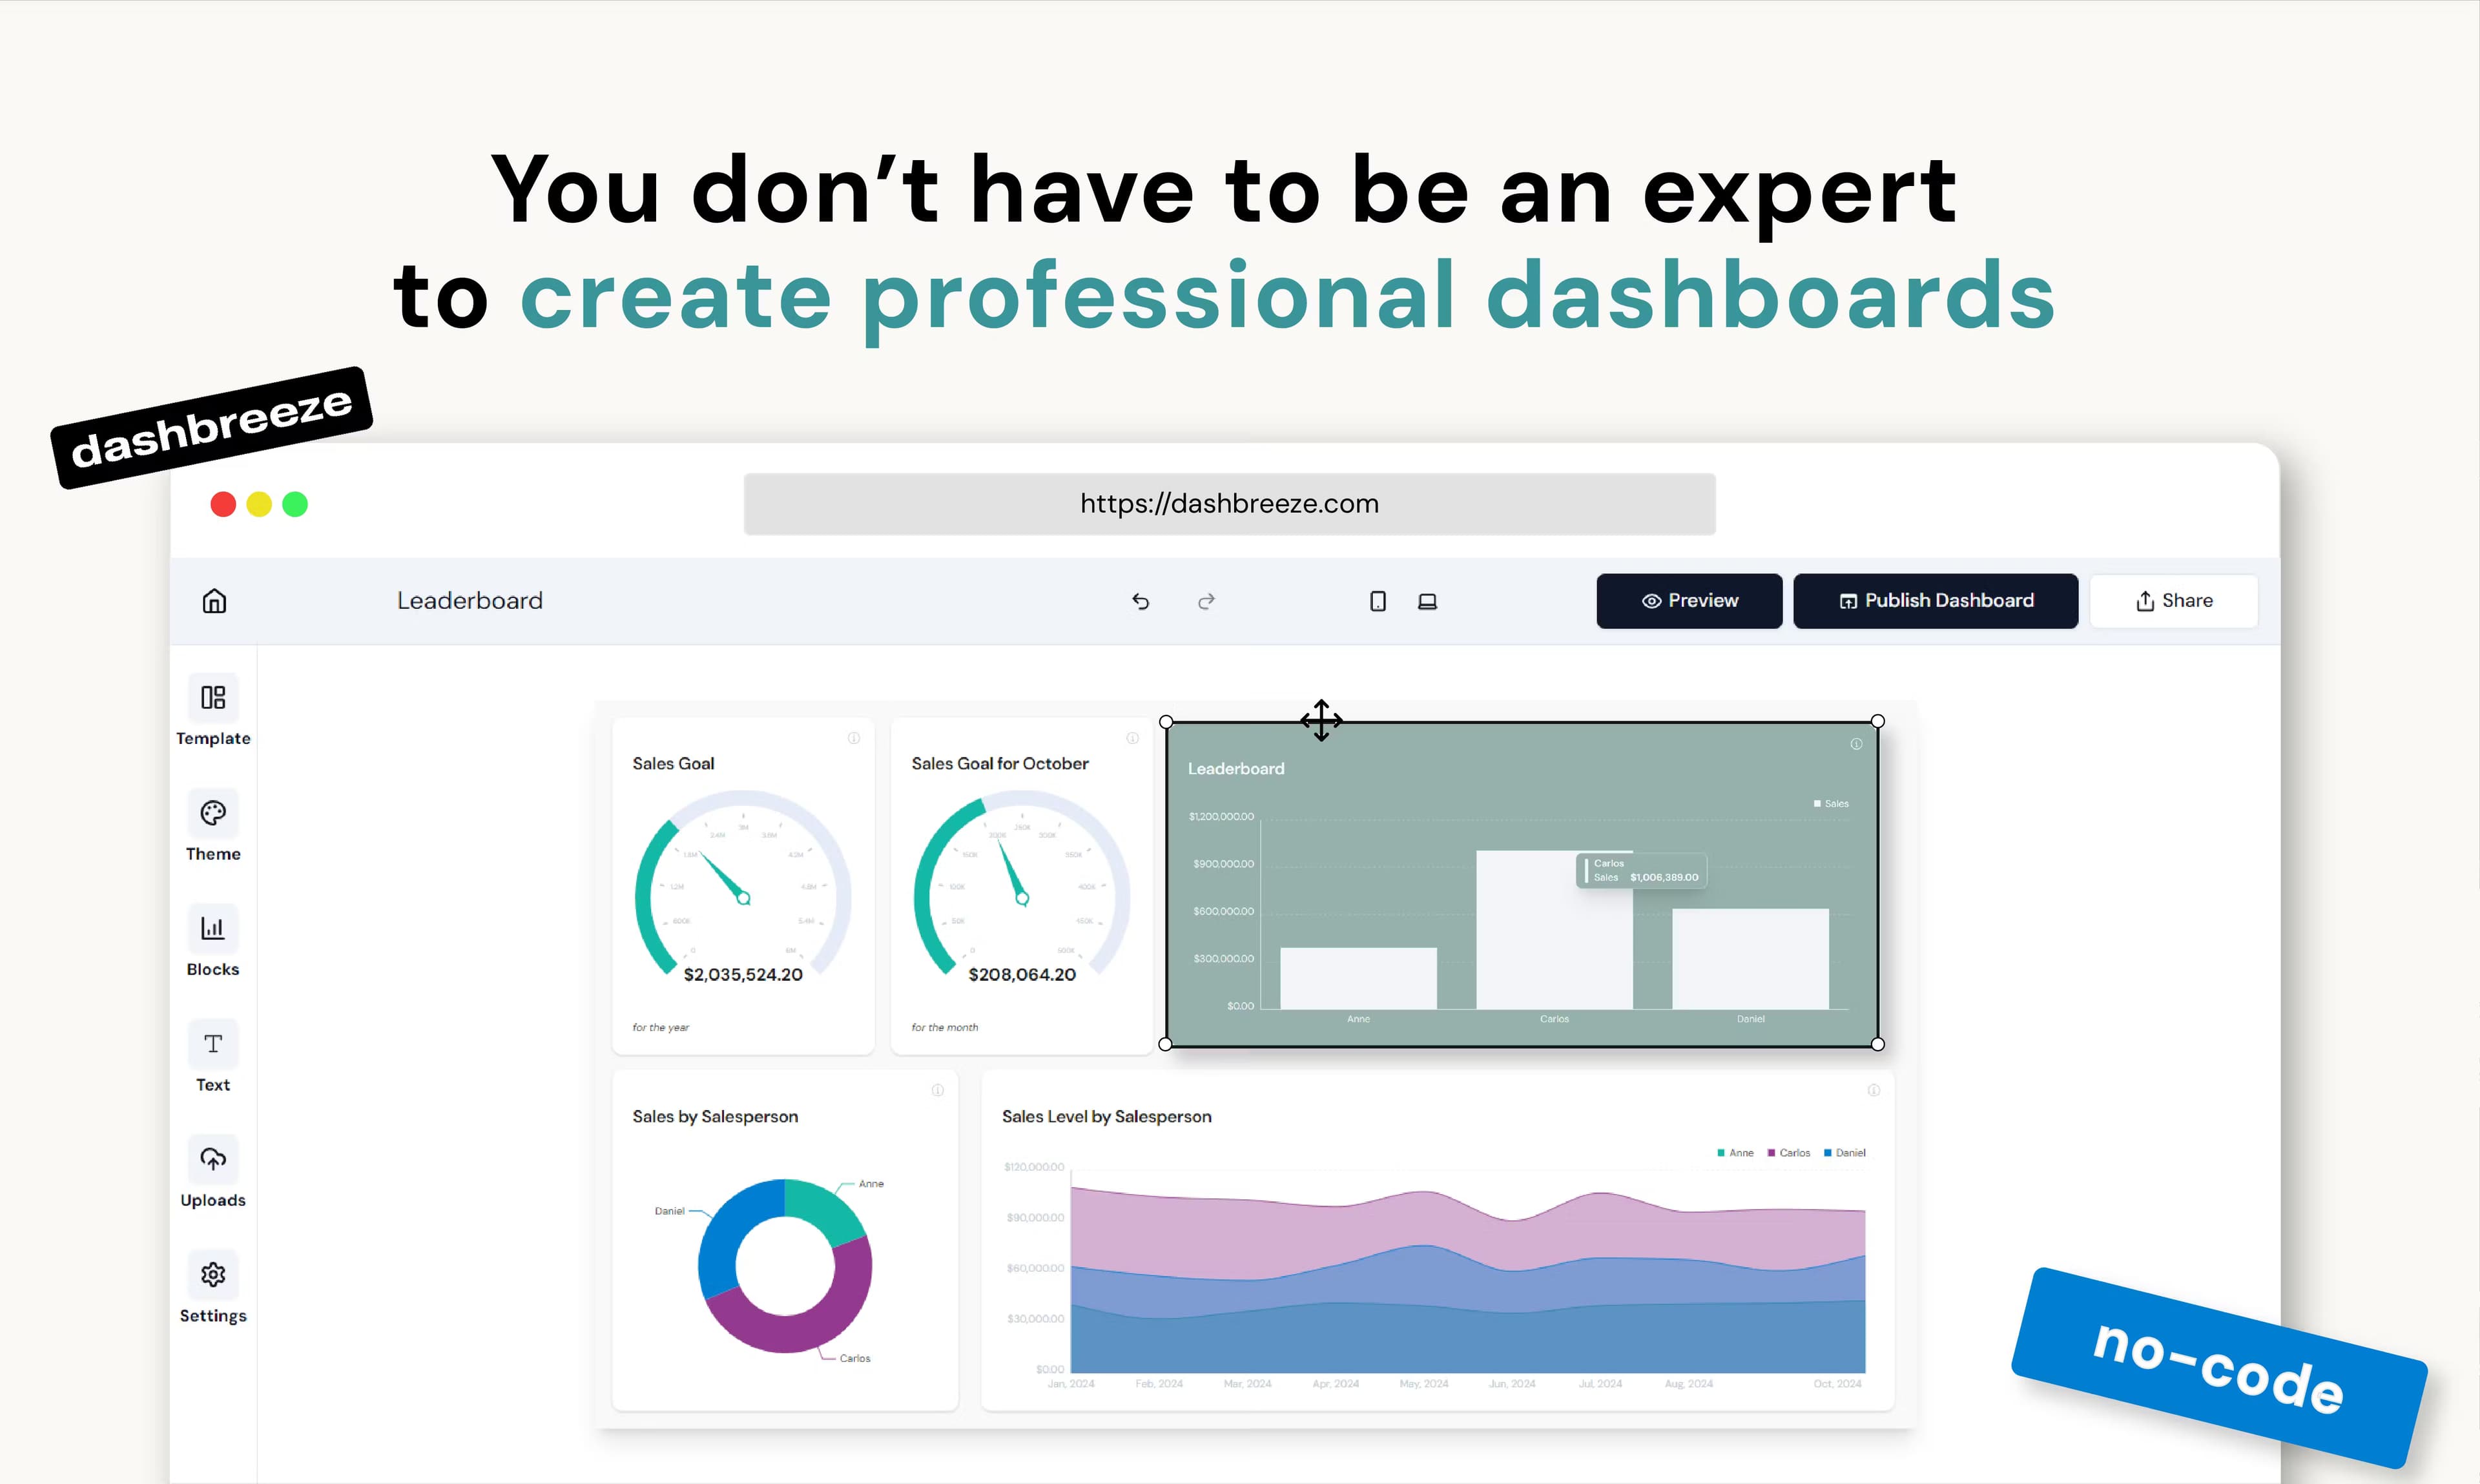
The AI can draft a dashboard for you. Nothing stays locked. Every chart, block, style, filter, and piece of layout is editable, so you can build a data dashboard with KPIs, tables, and text, then fine-tune labels and settings yourself. That balance matters for teams that want speed without losing control of the final view.
Data Source Connections
Dashbreeze connects to Google Sheets, Google Analytics, Notion, Airtable, Stripe, PostgreSQL, MySQL, and Microsoft SQL Server, plus direct file uploads. Supported sources sync automatically, so the numbers behind your dashboard update without you moving everything into a new tool. The free plan covers Google Sheets, Airtable, and Notion. The rest arrive on paid tiers.
Built-In Data Preparation
Real data is usually a little messy. Dashbreeze works as both a reporting tool and a data visualization tool, because you can clean and reshape the data before you analyze it. You can filter and sort records, rename columns, fix data types, control how values display, and combine related tables on matching columns. Calculated metrics and refreshed sources round out the prep work without a separate cleaning step.
Flexible Sharing
You can send a live dashboard instead of an export. Share it with a public link, lock it behind a password, or invite specific people by email, and embed it in another website or app with an iframe. Client-facing projects get read-only viewer invitations so clients can explore without editing your work.
Team Workspaces
Invite teammates into one workspace so connected data sources and dashboards stay shared across the team, and everyone can use the AI to ask questions and build charts. Member limits scale with your plan, from 5 on Starter to unlimited on Professional, which keeps small teams on cheap tiers and agencies on flexible ones.
Version History
On paid plans, Dashbreeze keeps a record of saved dashboard versions so you can restore an earlier state if an edit goes wrong. It's a quiet feature until you need it, and it saves rebuilding a dashboard from scratch after a botched change.
Pros and cons
Pros
- Plain-language questions replace most manual chart building, which cuts the learning curve for non-technical users.
- Free plan publishes a real, shareable dashboard instead of a locked demo, so you can test it on live data.
- Eight data sources plus file uploads cover the usual small-business stack without extra setup.
- Dashboards stay editable after the AI drafts them, giving you both speed and control.
Cons
- Auto-refresh tops out at every 10 minutes on the highest plan, so it can't support real-time monitoring.
- The free plan allows only one dashboard and caps file uploads at 20 MB, which limits heavier use.
- Private and password-protected sharing sits behind the Business plan, and it starts at $57 per month.
- There's no public API, so custom integrations have to go through the dashboard and embedding options.
Frequently asked questions
Dashbreeze is an AI business analytics dashboard for turning connected data into answers. You ask questions in plain language, get explanations with charts and metrics, then share the results as a live dashboard.
Related content
Explore related tools, skills, and articles for Dashbreeze.
Dashbreeze Alternatives

Base Code
Base44 (Wix) · Coding · ProductivityBase Code is a shared cloud development environment from Base44. Teammates describe changes to an existing GitHub codebase in chat, preview them live and send them back as pull requests.

Google EmbeddingGemma 2
Google DeepMind · Writing · Image · CodingGoogle EmbeddingGemma 2 is a 740M-parameter open model that turns text, code, images, audio, and video frames into vectors in one 768-dimension space, running on phones and laptops.

GitGlow
GitGlow · Coding · ProductivityGitGlow is a local-first desktop Git client that lets independent developers review their own code and their AI agents' changes in one place before shipping.