
Datrics AI Data Analyst
Datrics · Marketing
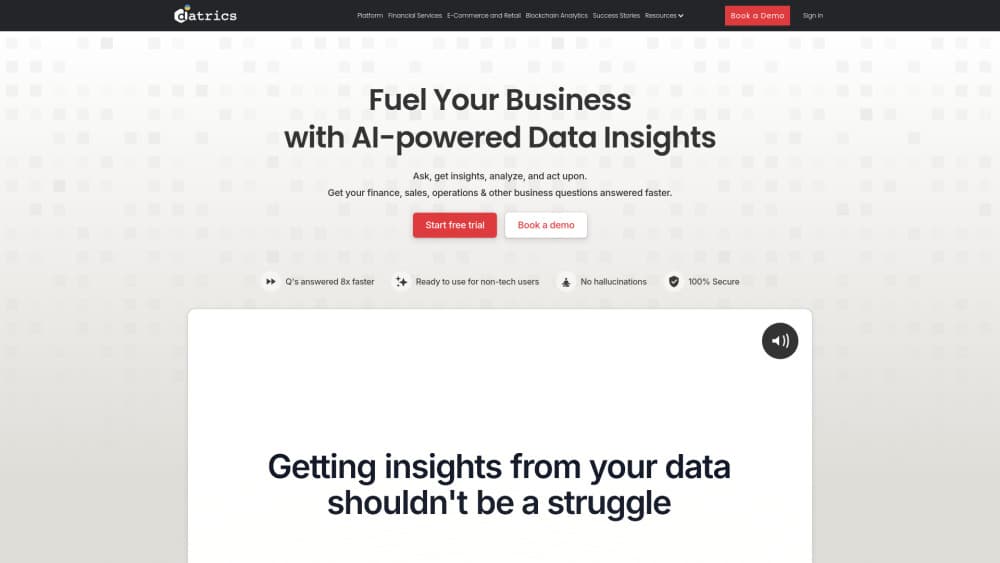
Datrics AI Data Analyst is a no-code platform for building custom AI analysts that answer business questions in plain language, then return charts, forecasts, and reports.
About Datrics AI Data Analyst
What Is Datrics AI Data Analyst
Datrics AI Data Analyst is a business intelligence platform built around a chat window instead of a dashboard builder. You ask a question the way you'd ask a colleague, such as how loan performance moved last quarter, and the tool answers with numbers, a chart, or a short written summary. The company behind it, Datrics, was founded in 2019 and went through Y Combinator as part of the W21 batch.
The product targets a specific gap: data insights without a report queue. Finance, sales, and operations managers usually wait on an analyst or dig through spreadsheets to get a straight answer. Datrics gives those managers a chat interface that sits on top of company data, with an admin panel where analysts define metrics, rules, and approved sources. Answers follow the company's own definitions rather than generic model guesses.
The limit worth knowing up front: this isn't a self-serve toy. A useful deployment needs a data connection, a metrics layer, and some configuration by whoever owns the numbers. Datrics also now markets its decision engine mainly to healthcare claims and regulated operations, so the general-purpose analytics product gets less public attention than it did in 2024.
Getting Started
- Book a demo or join the product waitlist on the Datrics site. There's no public sign-up form with a card.
- Connect the data sources you want the analyst to read, such as a warehouse, a database, or uploaded files. Access stays scoped to the tables you approve.
- In the admin panel, define the metrics and business rules the analyst should use, then test a few known questions against real numbers.
- Publish the custom AI analyst to the people who need it, either inside the Datrics web app or through Slack and Microsoft Teams.
- Check the first week of answers with an analyst at hand, then widen access once the definitions hold up.
Product Information
A quick look at Datrics AI Data Analyst's pricing, supported platforms, and performance.
Best for
The users, tasks, and scenarios where this tool fits best.
Users
- Finance managers at mid-size companies
- Sales and revenue operations leads
- Data and analytics teams serving non-technical colleagues
Tasks
- Asking follow-up questions on a report
- Producing a recurring business review
- Checking a metric definition before a board meeting
Scenarios
- Monday morning pipeline review
- Budget season at a bank or lender
- Onboarding a new regional manager
Key features
Conversational Data Q&A
The core interface is a chat box. Natural language queries go straight to your connected data, so conversational analytics returns a table, a chart, or a sentence. Follow-up questions keep the thread's context, so narrowing from annual revenue to one region takes a sentence rather than a new report request.
AI Analyst Builder
Analysts use the builder to create a custom AI analyst for a team, a process, or a data domain. Each one gets its own scope, tone, and allowed tables. That way a sales analyst never sees payroll tables, and a finance analyst doesn't have to filter out marketing campaign data before every question.
Business Logic Grounding
You load the definitions your company already uses: how revenue is recognized, which cost lines count as overhead, when a customer becomes active. The analyst answers from those rules, which cuts down on answers that look plausible but don't match the numbers in your board deck. This is the feature that separates a working deployment from a demo.
Charts, Forecasts, and Reports
Answers arrive as visualizations, not just text. You can request a trend line, a segment comparison, or a forecast for the next few quarters, then export the result as a CSV or have it emailed to you. Recurring reports can be scheduled, which covers the weekly and monthly packs that teams rebuild by hand.
Slack and Microsoft Teams Delivery
The analyst runs inside the chat tools your team already has open. Asking a question in a Slack channel returns the same answer and chart you'd get in the web app. It keeps adoption low-effort, since nobody has to learn a new interface to get a number.
Private Data Handling
Datrics says company data stays within your environment rather than leaving the premises, and deployments can run in your own cloud or a private setup. Access controls and an admin panel govern which sources each analyst can touch. For banks, insurers, and public sector buyers, that's usually the first question in a procurement review.
Low-Code Workflow Manager
Behind the chat sits a workflow layer for data preparation and scheduled jobs. Analysts use it to clean inputs, join tables, and refresh the datasets the analyst reads. It's visual rather than code-first, but it assumes someone who understands data modeling is driving.
Pros and cons
Pros
- Answers follow your own metric definitions, so the numbers line up with finance reporting instead of drifting.
- No-code analytics for the people asking questions, which shortens the gap between a business question and an answer.
- Runs inside Slack and Microsoft Teams, so adoption doesn't depend on a new tab anyone has to remember.
- Private deployment options and scoped access fit regulated industries better than most chat-based analytics tools.
- Exports and scheduled reports cover the recurring decks teams rebuild every month.
Cons
- No published pricing or self-serve trial. You have to talk to sales before you can test anything, which slows a small-team evaluation.
- The product is only as good as its configuration. Without clean tables and defined metrics, answers get vague fast.
- Public material now leans toward healthcare claims and compliance work, so documentation for general finance and sales use is thinner than it was a year ago.
- Not built for individual users or ad hoc personal spreadsheets. The value shows up at team scale with a real data source behind it.
Frequently asked questions
It answers business questions in plain language against your connected data and returns numbers, charts, forecasts, or a written summary. Analysts configure the metrics and rules once, then managers ask questions without writing SQL.
Related content
Explore related tools, skills, and articles for Datrics AI Data Analyst.
Datrics AI Data Analyst Alternatives

ngram 2.0
ngram · Video · Marketingngram 2.0 is an AI video generator for teams. It turns a prompt, a screen recording, or a product URL into a narrated explainer, product demo, or AI avatar video, and every scene stays editable.

shippedit.me
Krawlup · Marketing · Businessshippedit.me now redirects to Krawlup, a web platform that audits SEO, AEO and page speed every week, then hands the fixes to AI coding agents over MCP.

MePersona
MePersona, Inc. · Writing · Productivity · MarketingMePersona is an AI unified inbox for creators. It learns your voice, drafts replies to fan messages from 12 platforms, and sends only what you approve.