

DAWN
Raindrop AI (formerly Dawn AI) · Coding · Marketing
Dawn AI is an analytics platform for AI agents. It traces every model call and tool step, flags silent failures such as forgotten context, and lets teams test a fix before shipping it.
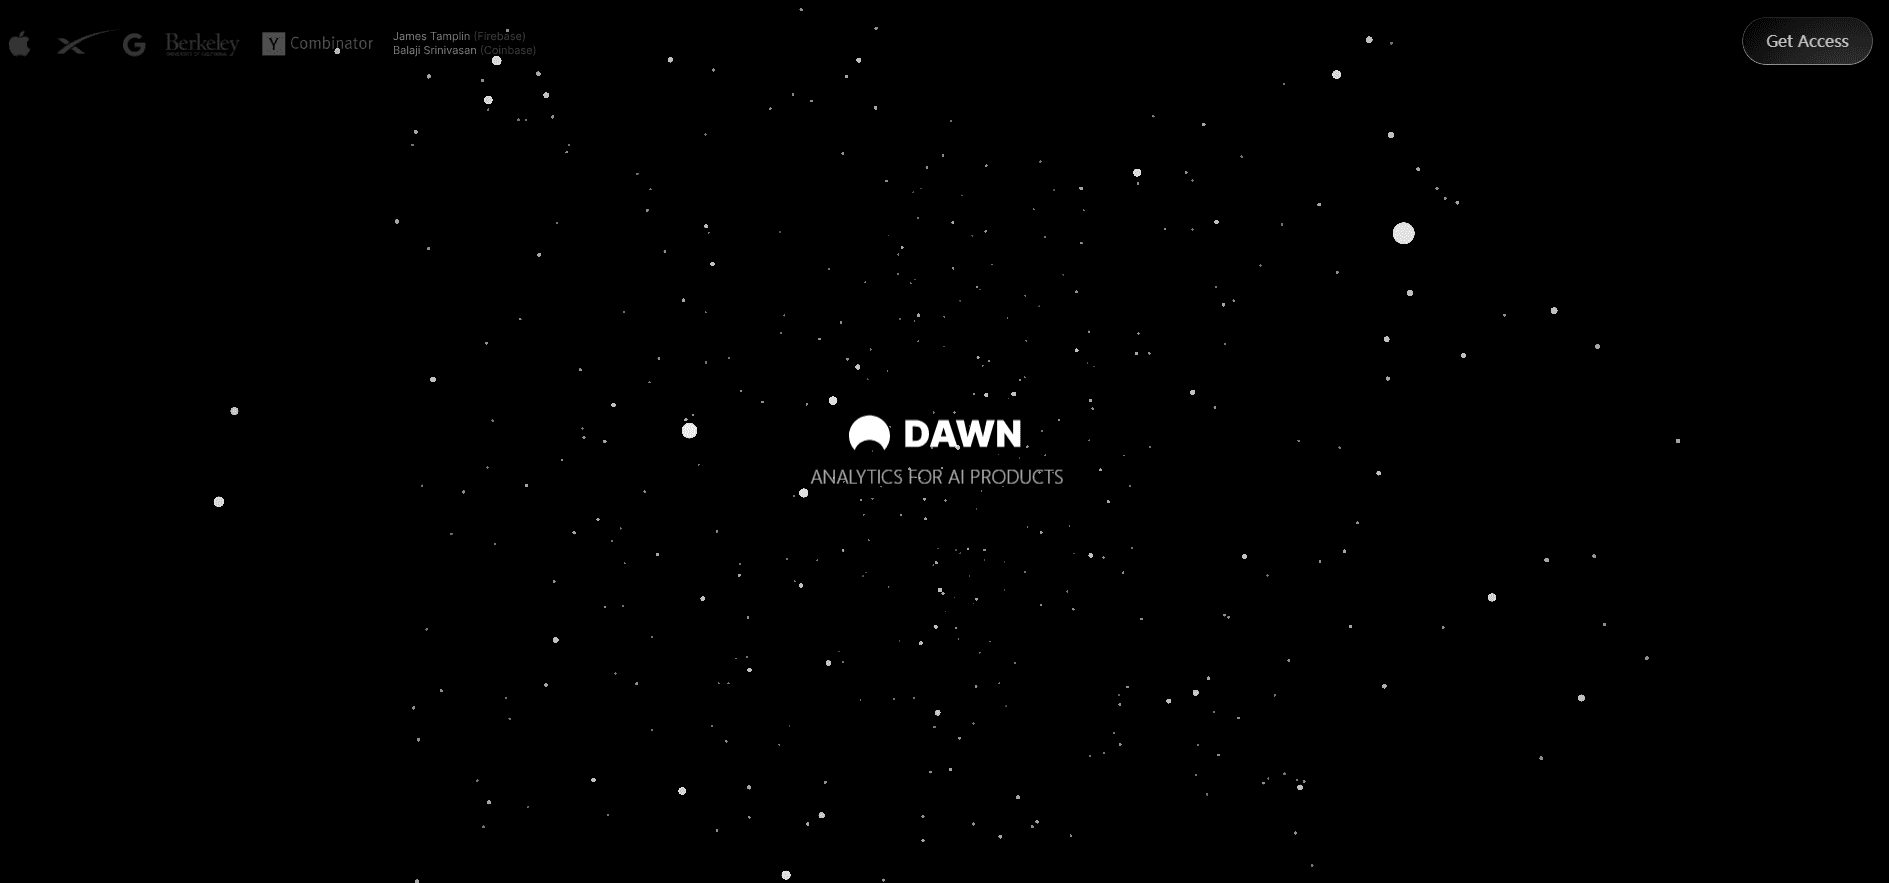
About DAWN
What Is Dawn
Dawn AI watches AI agents in production and tells you when one behaves badly. The product started as an AI agent analytics layer that turned user requests and model outputs into metrics. It now focuses on one job: finding the failures that never throw an error. An agent that answers a refund question with the wrong policy, or forgets what the customer said three messages ago, looks healthy to normal monitoring. There's no 500 status code to alert on.
That gap is the whole reason the product exists. Classic tools like Sentry were built for deterministic software, and logs from an agent run are thousands of small steps with no obvious failure marker. Dawn reads those steps as a timeline instead, so you can replay a run and see where it went sideways. If you've compared AI observability platforms before, this timeline view is the part that feels different in the first ten minutes.
One practical note before you sign up: dawnai.com now redirects to raindrop.ai and the product ships under the name Raindrop. Same team, same dashboard, wider scope. Older guides still call it Dawn AI, so expect to meet both names.
The limit worth knowing is effort. Nothing happens until your code sends events, and that means an engineer wires up an SDK or runs the setup skill inside a coding agent. Dawn is a tool for people who build and operate agents, not a dashboard a marketing team can turn on alone.
Getting Started
- Install the CLI with the one-line command from the docs, then run the cloud setup step. It signs you in through the browser and writes your write key to the local environment file.
- Run the setup skill in Claude Code, Cursor, Codex, or another coding agent. It finds your model call sites, adds instrumentation, and checks that events actually reach the dashboard.
- Or skip the automation and add an SDK yourself. TypeScript, Python, and a plain HTTP API are all supported, and the SDKs handle tracing for tool calls and sub-agents.
- Open the dashboard and read a few real runs. Pick a preset issue such as user frustration or a task failure, and let Dawn group similar failures into one issue.
- Test a change before you ship it. Run an experiment against the current version, compare the signal rates, and keep the variant that moves the number in the right direction.
Product Information
A quick look at DAWN's pricing, supported platforms, and performance.
Best for
The users, tasks, and scenarios where this tool fits best.
Users
- AI engineers at startups
- Product managers on AI features
- Support and success leads
Tasks
- Finding why an agent failed a specific task
- Measuring answer quality over time
- Checking whether a prompt or model swap helped
Scenarios
- Launching a customer-facing agent
- Migrating to a cheaper or newer model
- A spike of angry users with no error logs
Key features
Agent Trajectory Tracing
Trajectory tracing is the heart of the AI agent tracing here. Every run opens as a timeline of user messages, model calls, tool calls, and sub-agent handoffs. You can see exactly where a step broke, what the tool returned, and whether the agent recovered or drifted. For multi-agent setups this replaces a stack of log files that nobody reads.
Silent Failure Detection
Dawn ships presets that catch the failures normal monitoring misses: forgotten details, frustrated users, task failures, and agents stuck in a loop. Related failures get grouped into a single issue with a severity, so a bug that hits 40 users shows up as one item instead of 40 logs. Plenty of AI agent monitoring tools stop at errors and latency. This is the layer above it.
Natural Language Search
You can query production traffic the way you'd ask a colleague a question, then filter by user, severity, or date. It's how teams find the pattern behind a vague complaint, and it works on millions of stored interactions without writing SQL.
Custom Signals
Pick any behavior and track it at scale: syntax errors in generated code, aesthetic complaints about output, or an agent that retries the same tool forever. Each signal becomes a rate you can chart, alert on, and compare between releases.
Experiments Before You Ship
You can run a change as an experiment, split traffic between the old and new versions, and read the difference in negative signals. The comparison view shows the gap in percentage points, which makes a rollback decision a lot less emotional.
Pros and cons
Pros
- The failure presets cover the problems AI agents actually have, which makes AI agent failure detection practical instead of theoretical.
- Trajectory views stay readable with sub-agents and parallel tool calls, which is where most trace viewers turn into noise.
- The free Hobby tier includes 1,000 events a month and needs no credit card, so a side project can start without a purchase order.
- Security groundwork is real: SOC 2 Type II, server-side PII redaction, SSO and audit logs on the enterprise plan.
Cons
- The jump from free to Pro is steep. $299 per month plus $0.003 per event is fine for a funded team, painful for a two-person project that outgrows 1,000 events.
- The free tier keeps only 14 days of history, which means you can't compare a release against a month-old baseline without paying.
- Nothing works until an engineer instruments the code, so teams without a developer can't evaluate it on their own.
Frequently asked questions
It handles LLM analytics for AI agents in production and finds failures that produce no error code, such as wrong answers, dropped context, or endless tool loops. You get a trace of each run, grouped issues, and a signal rate you can track across releases.
Related content
Explore related tools, skills, and articles for DAWN.
DAWN Alternatives

Base Code
Base44 (Wix) · Coding · ProductivityBase Code is a shared cloud development environment from Base44. Teammates describe changes to an existing GitHub codebase in chat, preview them live and send them back as pull requests.

Google EmbeddingGemma 2
Google DeepMind · Writing · Image · CodingGoogle EmbeddingGemma 2 is a 740M-parameter open model that turns text, code, images, audio, and video frames into vectors in one 768-dimension space, running on phones and laptops.

GitGlow
GitGlow · Coding · ProductivityGitGlow is a local-first desktop Git client that lets independent developers review their own code and their AI agents' changes in one place before shipping.