

Digma Preemptive Observability
Digma (part of the JetBrains AI Platform) · Coding
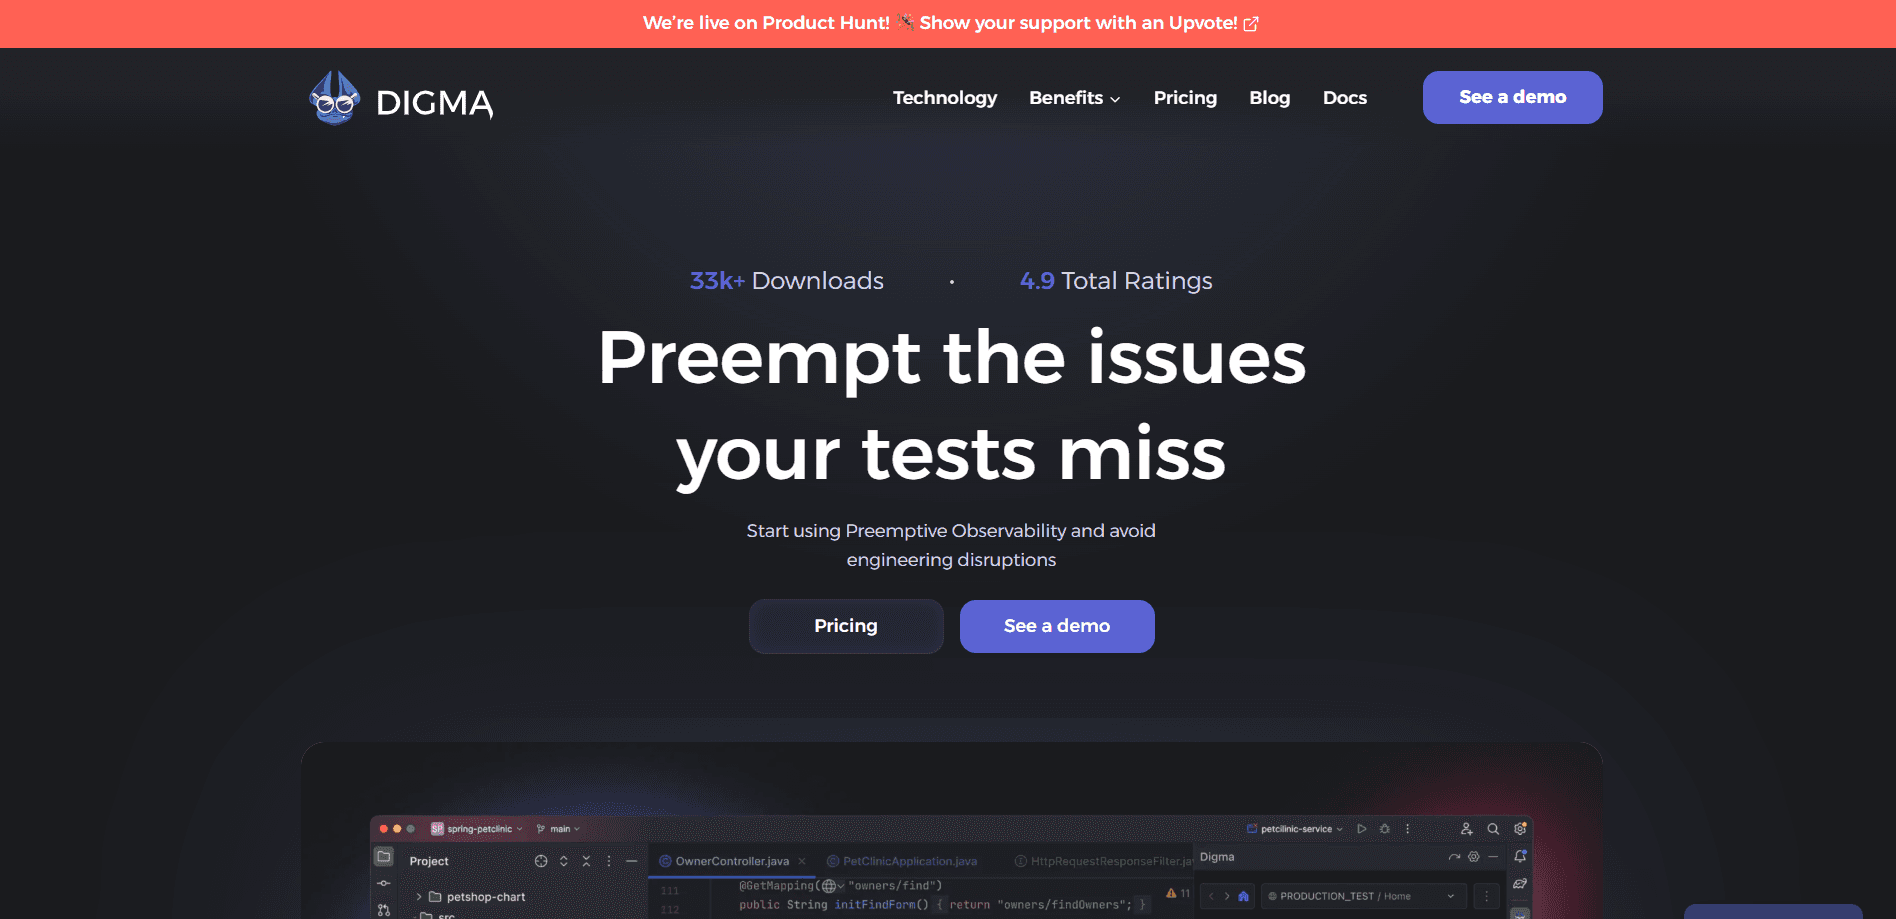
Digma is a continuous feedback platform that profiles your app at runtime and flags performance issues right inside your IDE before they hit production. The whole point is preemptive observability: catching runtime problems while you still have the context to fix them.
About Digma Preemptive Observability
What Is Digma
Digma is a developer tool built around one idea: observability should improve your code, not just fill dashboards. It watches how your application actually runs, then points out the bottlenecks, slow queries, and scaling risks hiding in that runtime data. You see the problems in the editor while you still have the context to fix them.
The tool ships as an analysis backend plus an IDE plugin, with IntelliJ IDEA as the main front end. It reads OpenTelemetry traces from your app and turns them into code-level insights. The company behind it, Digma, was founded in 2022 in Santa Clara, California, by Nir Shafrir and Roni Dover.
Two limits matter before you adopt it. It runs locally rather than in the cloud, which is good for compliance but means you manage the backend yourself. And the language coverage is narrow today. Java and Kotlin on IntelliJ are the primary targets, with .NET on Rider in early access.
Getting Started
- Install the Digma IntelliJ plugin from the JetBrains Marketplace. No paid tier or cloud account is needed.
- Follow the plugin's setup prompts to start the local analysis backend.
- Instrument your app with the standard OpenTelemetry agent. The default Java strategy needs no code changes.
- Run your code as usual. Digma collects traces and begins analyzing execution.
- Open the insights panel to review flagged issues and jump straight to the relevant line in your code.
Product Information
A quick look at Digma Preemptive Observability's pricing, supported platforms, and performance.
Best for
The users, tasks, and scenarios where this tool fits best.
Users
- Backend developers on the JVM
- Platform and SRE engineers
Tasks
- Tracking down N+1 queries
- Finding scaling risks before launch
- Catching chatty API calls between microservices
Scenarios
- Debugging a slow endpoint in a complex codebase
- Reviewing a change that could regress performance
- Air-gapped or compliance-bound environments
Key features
Runtime Profiling Without Code Changes
Digma does runtime profiling on your application as it executes, using the standard OpenTelemetry instrumentation plus a few attributes of its own. You add no tracing code, and the tool leaves your source untouched. The payoff is a feedback loop that runs while you work rather than only after something breaks.
Code-Level Performance Insights
The analysis backend turns raw traces into named issues such as suspected N+1 queries, bottlenecks, slow endpoints, and high query counts. Each one lands next to the code that triggers it, so a slow endpoint shows up on the method responsible for the delay. That link between symptom and source is the core of the product.
Scaling Analysis
One insight looks at how a piece of code performs when several requests run at once, then attempts a root cause analysis of any slowdown. It answers a question dashboards rarely settle: will this function hold up as traffic grows? The answer comes back tied to specific assets rather than a vague warning.
Local, Private By Default
Everything runs on your machine or in a cluster you control. No observability data goes to a Digma cloud, which is why the tool works in environments with strict compliance rules. Teams can also move to a central on-prem install on Kubernetes when several people need to share the same analysis.
IDE-First Workflow
The IntelliJ plugin is the main interface, so IDE observability appears inside the editor instead of a separate monitoring site. You can jump from a flagged issue straight to the relevant code and act on it without switching context. The tool sits alongside Jaeger, Prometheus, and traditional APM platforms rather than replacing them.
Pros and cons
Pros
- Free forever for individual developers, with no cloud account required.
- Runs locally, so trace data stays on your machine and fits compliance policies.
- Needs no code changes for the default Java setup, which lowers adoption friction.
- Surfaces issues on the code itself, which shortens the path from symptom to fix.
Cons
- Language and IDE coverage is narrow. Java and Kotlin on IntelliJ lead, and .NET on Rider is still early access.
- You manage the local backend yourself, so setup and resource use fall on you or your team.
- It depends on OpenTelemetry data being collected, and thin instrumentation limits what it can analyze.
Frequently asked questions
Digma profiles how your application runs and turns that runtime data into code-level performance insights. You get flagged issues like slow queries and bottlenecks shown inside your IDE, close to the code that causes them.
Related content
Explore related tools, skills, and articles for Digma Preemptive Observability.
Digma Preemptive Observability Alternatives

Base Code
Base44 (Wix) · Coding · ProductivityBase Code is a shared cloud development environment from Base44. Teammates describe changes to an existing GitHub codebase in chat, preview them live and send them back as pull requests.

Google EmbeddingGemma 2
Google DeepMind · Writing · Image · CodingGoogle EmbeddingGemma 2 is a 740M-parameter open model that turns text, code, images, audio, and video frames into vectors in one 768-dimension space, running on phones and laptops.

GitGlow
GitGlow · Coding · ProductivityGitGlow is a local-first desktop Git client that lets independent developers review their own code and their AI agents' changes in one place before shipping.