

DollarDrip
DollarDrip · Business
DollarDrip is a web app for planning dollar-cost averaging portfolios, with AI weight suggestions, growth projections, and community portfolios for long-term investors.
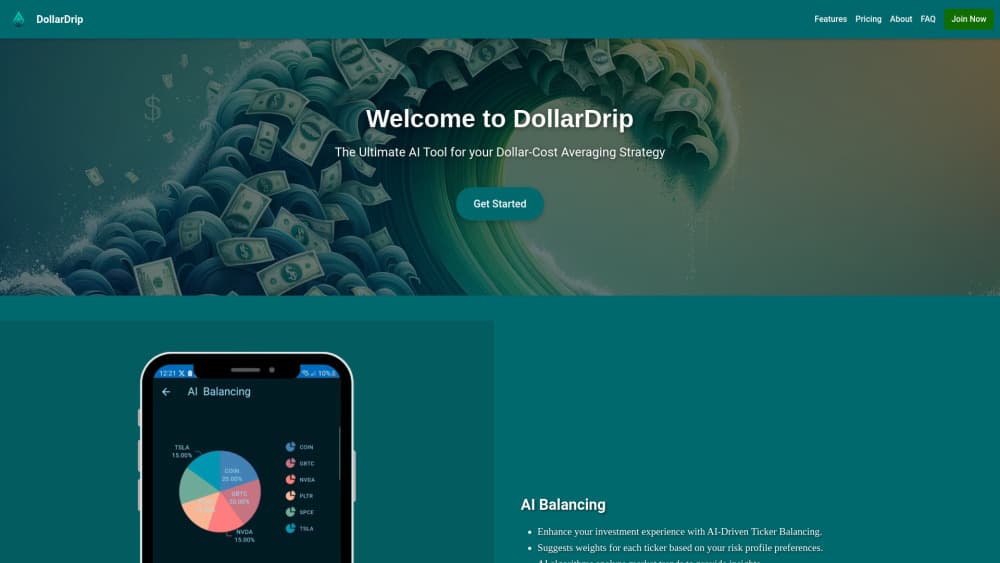
About DollarDrip
What Is DollarDrip
DollarDrip is a browser-based planning tool for people who invest a fixed amount on a schedule. You pick the tickers, set the monthly amount, and the site draws a projected value curve from historical growth rates. An AI layer can suggest how to split the money across your picks.
As an AI investing tool, it isn't a broker. No money moves through it, and you can't buy shares inside the app. It's a planning and comparison layer that sits between a spreadsheet and a full investment portfolio tracker. That distinction matters if you expect trade execution.
Its main limit is data depth. The projections lean on past price behavior, which says little about a company's next earnings report. Treat the output as a way to sanity check a plan, not a forecast.
Getting Started
- Open app.dollardrip.io and create a free account with an email address.
- Add up to three tickers on the free plan, then type your target percentage for each one.
- Set the contribution amount and interval, such as $200 every month.
- Check the projection chart, save the portfolio, and bookmark a couple of public ones to compare.
Product Information
A quick look at DollarDrip's pricing, supported platforms, and performance.
Best for
The users, tasks, and scenarios where this tool fits best.
Users
- Long-term index fund investors
- Beginners testing a plan
- ETF hobbyists comparing allocations
Tasks
- Testing a monthly DCA schedule
- Comparing sector allocations
- Following news on held tickers
- Getting feedback on an allocation
Scenarios
- Planning a first $200 monthly contribution
- Reviewing a yearly contribution change
- Choosing between two ETF mixes
Key features
AI Portfolio Balancing
The AI portfolio balancing feature proposes weights for each ticker in a portfolio. You choose an aggressive or moderate profile, and the tool returns a suggested split with the reasoning behind it. Final control stays with you, since every weight remains editable. This is the main reason to move up from the free plan, where the feature isn't included.
Growth Projections
The portfolio projection tool builds a line chart from each ticker's historical growth rate and your contribution schedule. You see total value over time plus a per holding view of which positions drive the result. Switching intervals recalculates the curve right away, which makes it practical to test several monthly amounts in one sitting.
Multiple Portfolios
Paid accounts can hold several portfolios at once, from two on the entry plan up to six on the top tier. Each one keeps its own tickers, weights, and contribution settings, so a retirement mix and a short term experiment don't collide. Comparing two saved portfolios is the fastest way to settle an allocation argument with yourself.
Community Portfolios
Users publish portfolios with a category tag, and others can bookmark or comment on them. It works as a browsing library for allocation ideas rather than a social network. Quality varies, since anyone can post, so read the comments before copying weights.
Ticker News Feed
Each ticker gets a headline feed aggregated from outside sources. The value is convenience: one page shows what's moving the symbols you actually hold, instead of a general market scroll. It doesn't summarize or score the news, so you still do the reading.
DCA Calculator
The DCA calculator models fixed contributions at weekly, monthly, or quarterly intervals. It shows the projected value of those buys and how the distribution shifts when you change a weight. For anyone running a dollar-cost averaging app search, this is the part that replaces a manual spreadsheet.
Pros and cons
Pros
- Free tier is usable, with one portfolio and three tickers, so you can test the workflow without a card.
- AI weight suggestions give a starting point when you don't know how to split a monthly budget.
- Projection charts update instantly when you change an interval or weight, which speeds up comparison.
- Community portfolios offer real allocation examples instead of generic template advice.
- Annual plans cost about two months less than paying monthly, at every paid level.
Cons
- No brokerage link and no trade execution, so you copy the plan into another platform by hand.
- AI balancing sits behind the $9.99/mo tier, which makes the free plan feel like a demo.
- Projections rely on historical growth rates and can look far more certain than they are.
- Free accounts get three bookmarks, which runs out fast if you like browsing public portfolios.
Frequently asked questions
It plans and visualizes dollar-cost averaging portfolios. You enter tickers, weights, and a contribution schedule, then review a projected value chart. It doesn't hold funds or place trades.
Related content
Explore related tools, skills, and articles for DollarDrip.
DollarDrip Alternatives
Knocket
Knocket (Tencent RTC team) · Productivity · Business · ChatbotKnocket is a free live chat and contact page tool that lets visitors message you from your website, app, or a shareable link, with every reply handled from Telegram or one inbox.

shippedit.me
Krawlup · Marketing · Businessshippedit.me now redirects to Krawlup, a web platform that audits SEO, AEO and page speed every week, then hands the fixes to AI coding agents over MCP.

Ayven
Alknoma · Productivity · BusinessAyven is an AI control centre by Alknoma that turns a plain-language goal into a dated plan, hands the work to your people and AI agents, and asks for your approval only when the call is yours.