

Helicone
Helicone, Inc. · Coding
Helicone is an open source LLM observability platform and AI gateway. Swap one base URL to log every prompt, track spend and route 100+ models.
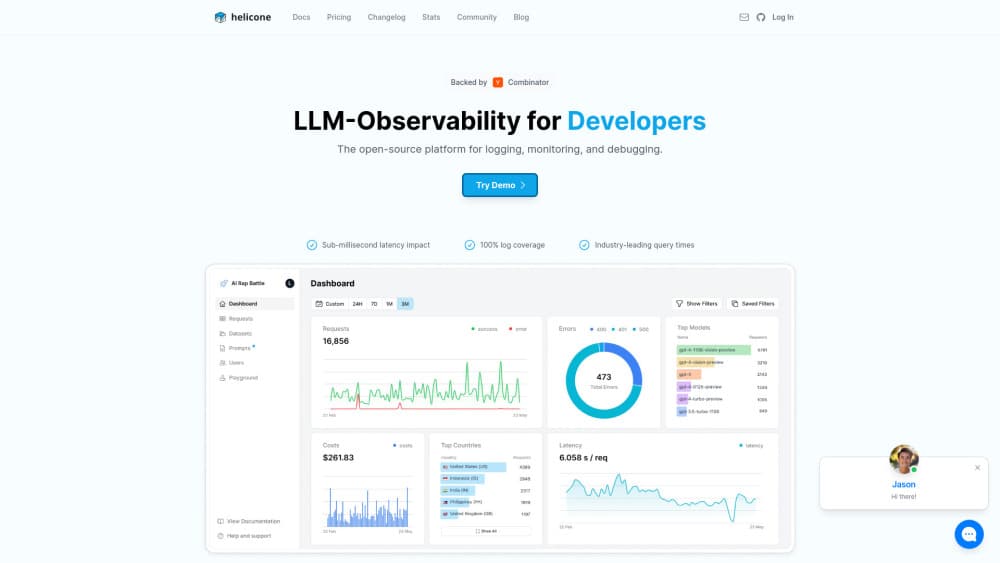
About Helicone
What Is Helicone
Helicone sits between your app and the model provider. Point the OpenAI SDK at its gateway address, or add the proxy URL to calls you already make, and each request shows up in a dashboard with the prompt, the response, token counts, cost and latency attached.
That answers the questions developers ask a week after launch. Why does one customer's chat cost 40 cents. Which prompt broke the JSON output. Whether the slowdown came from your own server or from the provider. Request logs stay searchable, and you can group them by user, session or any custom property you define.
The project is open source under Apache 2.0, with a self-hosted option for teams that won't send prompts to a third party. Two limits decide who gets real value here. You need access to the code that calls the model, since setup means changing a base URL and adding a header. The evaluation side is lighter than what dedicated eval platforms offer, so teams running large experiment suites usually keep a second tool.
Getting Started
- Sign up for the free account and create an API key in the settings page.
- Point your OpenAI client at the Helicone gateway, or send existing calls through the proxy URL with a Helicone-Auth header.
- Fire one request and open the Requests tab; the log appears within seconds.
- Tag calls with custom properties such as user ID or plan, so spend can be split later.
- Set an alert on cost or error rate, then invite the rest of the team.
Product Information
A quick look at Helicone's pricing, supported platforms, and performance.
Best for
The users, tasks, and scenarios where this tool fits best.
Users
- Engineering teams shipping LLM features
- Solo developers and small startups
- Platform and DevOps teams
- Teams with data rules
Tasks
- Debugging a bad response
- Watching spend
- Switching providers
- Comparing prompts
- Auditing usage
Scenarios
- A chatbot that got expensive after launch
- A prototype that needs to try three models this week
- A regulated environment
Key features
One-Line Integration
Setup is a base URL change plus an API key, so an existing OpenAI, Anthropic, Azure or LiteLLM client keeps its code shape. There's nothing to install on the server and no agent to run, which is why teams get logs on the same afternoon they sign up. The proxy route works for any language that can send an HTTP request.
Request Logs and Traces
Each entry keeps the full prompt, the model response, token counts, latency and calculated cost. You can filter by model, status, time range or custom property, then open a single request to see where the time went. Prompt logging at this level turns a vague complaint into a specific line of text you can edit.
AI Gateway with Caching and Fallbacks
The AI gateway is an OpenAI-compatible endpoint covering 100+ models from OpenAI, Anthropic, Google, Vertex, Groq and others. It adds response caching, per-key rate limits and automatic fallbacks when a provider fails, and credits are billed at provider cost with no markup. You can also bring your own provider keys if you'd rather keep billing separate.
User and Session Analytics
Custom properties let you attach a user ID, plan, feature name or any other tag to a request. Sessions then group a multi-turn conversation into one view, so you can see the cost and length of a real customer journey. For a support team, that's the difference between "the bot is slow" and "this account hits a 12-second tool call every time".
Playground and Prompt Management
The playground runs prompts against several models side by side and shows the reasoning settings for models that expose them. Prompts can be saved, versioned and reused from code, and outputs can be scored so a change is judged on results rather than vibes. It's a quick way to test a cheaper model before routing production traffic to it.
Alerts, Reports and HQL
Alerts fire on cost, error rate or latency thresholds, and scheduled reports push a summary to email or Slack. HQL, the built-in query language, handles the questions the dashboard filters can't express, such as cost per user over the last 30 days. Results can be exported or pulled through the API into a warehouse.
Open Source and Self-Hosting
The code base is public under Apache 2.0, with thousands of GitHub stars and an active release cadence. You can run the whole stack in your own cloud with Docker, which matters when prompts contain customer data that legal won't let you ship to a vendor. The hosted version and the self-hosted one share the same dashboard and API.
Pros and cons
Pros
- One base URL change starts the logging, so there's no SDK rewrite or migration project.
- The gateway covers 100+ models at provider cost with no markup, plus caching and fallbacks in the same key.
- Open source under Apache 2.0, with a self-hosted path for teams under data rules.
- The free tier is usable rather than a demo: 10,000 requests a month, 1 GB of storage, no card required.
- Cost, latency and errors sit on one screen per request, per user and per session, which saves the spreadsheet work.
Cons
- It's built for developers. Without access to the code that calls the model, the dashboard has nothing to show.
- Evaluation and dataset features are thinner than on dedicated eval platforms, so serious experiment tracking means a second tool.
- Pro starts at $79/mo and usage-based metering on requests and storage makes the bill hard to predict once traffic grows.
- The free plan keeps logs for 7 days and 1 GB, so any long-term history needs a paid plan.
Frequently asked questions
It logs and analyzes calls your app makes to LLM providers. You get request logs with prompts, responses, token counts, cost and latency, plus a gateway that can route those calls to more than 100 models.
Related content
Explore related tools, skills, and articles for Helicone.
Helicone Alternatives

Base Code
Base44 (Wix) · Coding · ProductivityBase Code is a shared cloud development environment from Base44. Teammates describe changes to an existing GitHub codebase in chat, preview them live and send them back as pull requests.

Google EmbeddingGemma 2
Google DeepMind · Writing · Image · CodingGoogle EmbeddingGemma 2 is a 740M-parameter open model that turns text, code, images, audio, and video frames into vectors in one 768-dimension space, running on phones and laptops.

GitGlow
GitGlow · Coding · ProductivityGitGlow is a local-first desktop Git client that lets independent developers review their own code and their AI agents' changes in one place before shipping.