

IndexBox
IndexBox, Inc. · Business
IndexBox is an AI market intelligence platform that turns global trade and market statistics into forecasts, dashboards, and reports for analysts and supply chain teams.
About IndexBox
What Is IndexBox
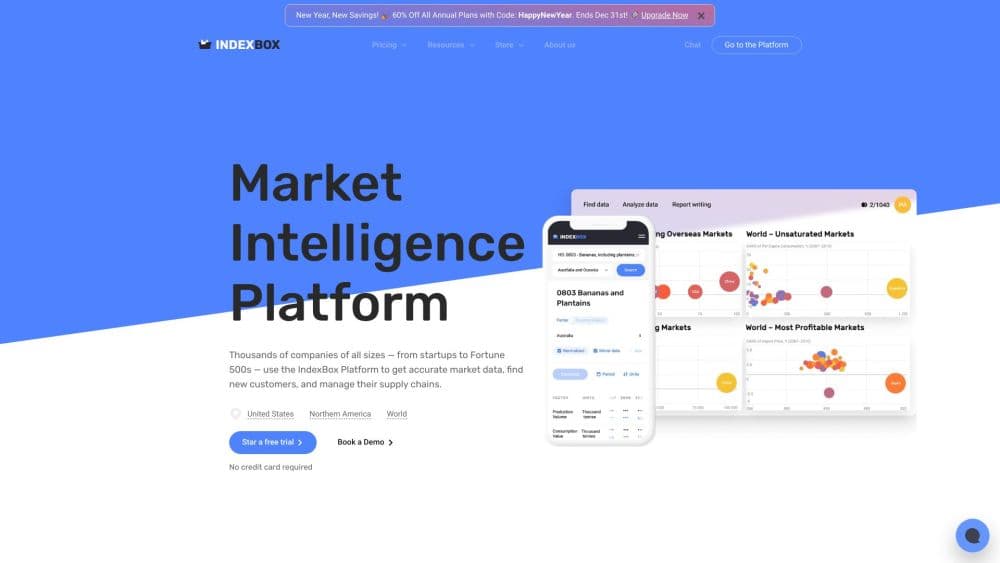
IndexBox is a market intelligence platform that gathers trade and market statistics from official sources and turns them into forecasts, dashboards, and reports. Analysts, importers, and supply chain teams use it to understand demand, pricing, and competition across more than 200 regions.
The problem it addresses is scattered, inconsistent data. Official statistics arrive late, cover different periods, and leave gaps, so someone has to clean, cross-check, and model the numbers before they mean anything. IndexBox runs that work on its own servers, then hands over finished tables, charts, and downloadable files.
The tradeoff is cost and fit. IndexBox is built for professional market analysis, not casual browsing, and the entry tier starts at $140 a month with only limited online access. If you just need a one-off stat, a free report sample is the cheaper route.
Getting Started
- Sign up for a free trial or request a sample report from the IndexBox site.
- Set a monthly product and region so the platform knows which data to open up.
- Explore tables, dashboards, and companies for that product, then check how sources and models were tracked.
- Download a file for credits or run custom searches through the API on higher tiers.
- Combine the exports into your own forecast or procurement dashboard.
Product Information
A quick look at IndexBox's pricing, supported platforms, and performance.
Best for
The users, tasks, and scenarios where this tool fits best.
Users
- Market analysts
- Import and export teams
- Supply chain managers
Tasks
- Forecasting market growth
- Comparing country-level trade
- Building a client-ready report
Scenarios
- Early market research on a new category
- Recurring quarterly reporting
- Validating a purchasing decision
Key features
Predictive Modeling
IndexBox trains machine learning models on billions of data points to forecast market growth, demand, and prices. Where official sources leave gaps, the platform estimates the missing indexes so a series stays continuous. That is the core reason analysts use it instead of raw government data.
Data Cross-Checking
Algorithms pull from multiple information sources and cross-check them to flag outliers and validate figures. The platform re-checks collected statistics, restores missing data, and cleans what it finds. For a report that has to hold up in a client meeting, that layer matters.
Global Coverage
The platform spans 10,000+ products by HS code across 200 countries split by region. It checks more than 100 data sources daily for statistical updates, so the numbers move with official releases rather than sitting stale. Regional splits let you zoom from a global view down to one market.
Tables, Dashboards, and Reports
Every product view comes as a table, a dashboard, and a report, and files export to Excel, PowerPoint, and Word. Higher tiers include free downloads each month, while lower tiers pay per file with credits. Teams use these exports directly in decks and internal dashboards.
Company Lead Data
IndexBox lists companies tied to a product or region, which helps you find buyers and suppliers rather than only reading charts. Access runs on credits or by plan, with Business covering 100 companies a month and Enterprise covering 300. It connects market analysis to actual outreach.
API Access
Business and Enterprise plans include API access, up to 10,000 calls a month on Business and up to 100,000 on Enterprise. You can pull tables and data into your own tools instead of downloading files by hand. Lower tiers have no API, so automation starts at the $490 Business tier.
Source and Model Tracking
You can trace which data sources and which predictive models produced a given number. That traceability lets a team explain how a forecast was built when someone questions it. It is what separates a researched figure from a black-box estimate.
Custom Search Requests
Higher plans include a set number of custom search requests per month, measured in keywords. Starter covers 1, Business covers 30, and Enterprise covers 90. If your questions fall outside the standard product views, this is how you get them answered.
Pros and cons
Pros
- Forecasts fill gaps that official statistics leave open, so a market series stays usable across periods.
- Over 100 data sources are checked daily, which keeps figures aligned with the latest official releases.
- Tables, dashboards, and reports export to Excel, PowerPoint, and Word, cutting manual formatting for analysts.
- API access on Business and Enterprise lets teams pull data into their own tools instead of downloading files.
- A free trial and sample report let you test the data before committing to a paid subscription.
Cons
- The entry tier starts at $140 a month and only opens one selected product, which is steep for occasional research.
- There is no API on Starter or Smart, so automation requires the $490 Business tier or higher.
- Credits for extra file downloads add cost on top of the subscription, which complicates budgeting for heavy users.
Frequently asked questions
IndexBox is used to research and forecast markets. Teams pull trade and market data for a product across 200+ regions, then use predictive models, tables, and reports to understand demand, pricing, and competitors. It suits analysts, importers, and supply chain planners rather than casual readers.
Related content
Explore related tools, skills, and articles for IndexBox.
IndexBox Alternatives

Knocket
Knocket (Tencent RTC team) · Productivity · Business · ChatbotKnocket is a free live chat and contact page tool that lets visitors message you from your website, app, or a shareable link, with every reply handled from Telegram or one inbox.

shippedit.me
Krawlup · Marketing · Businessshippedit.me now redirects to Krawlup, a web platform that audits SEO, AEO and page speed every week, then hands the fixes to AI coding agents over MCP.

Ayven
Alknoma · Productivity · BusinessAyven is an AI control centre by Alknoma that turns a plain-language goal into a dated plan, hands the work to your people and AI agents, and asks for your approval only when the call is yours.