

Latitude
Latitude Data S.L. · Other
Latitude is an open-source platform for monitoring AI agents in production. It traces real traffic, groups failures into signals, and can hand a fix to your coding agent.
About Latitude
What Is Latitude
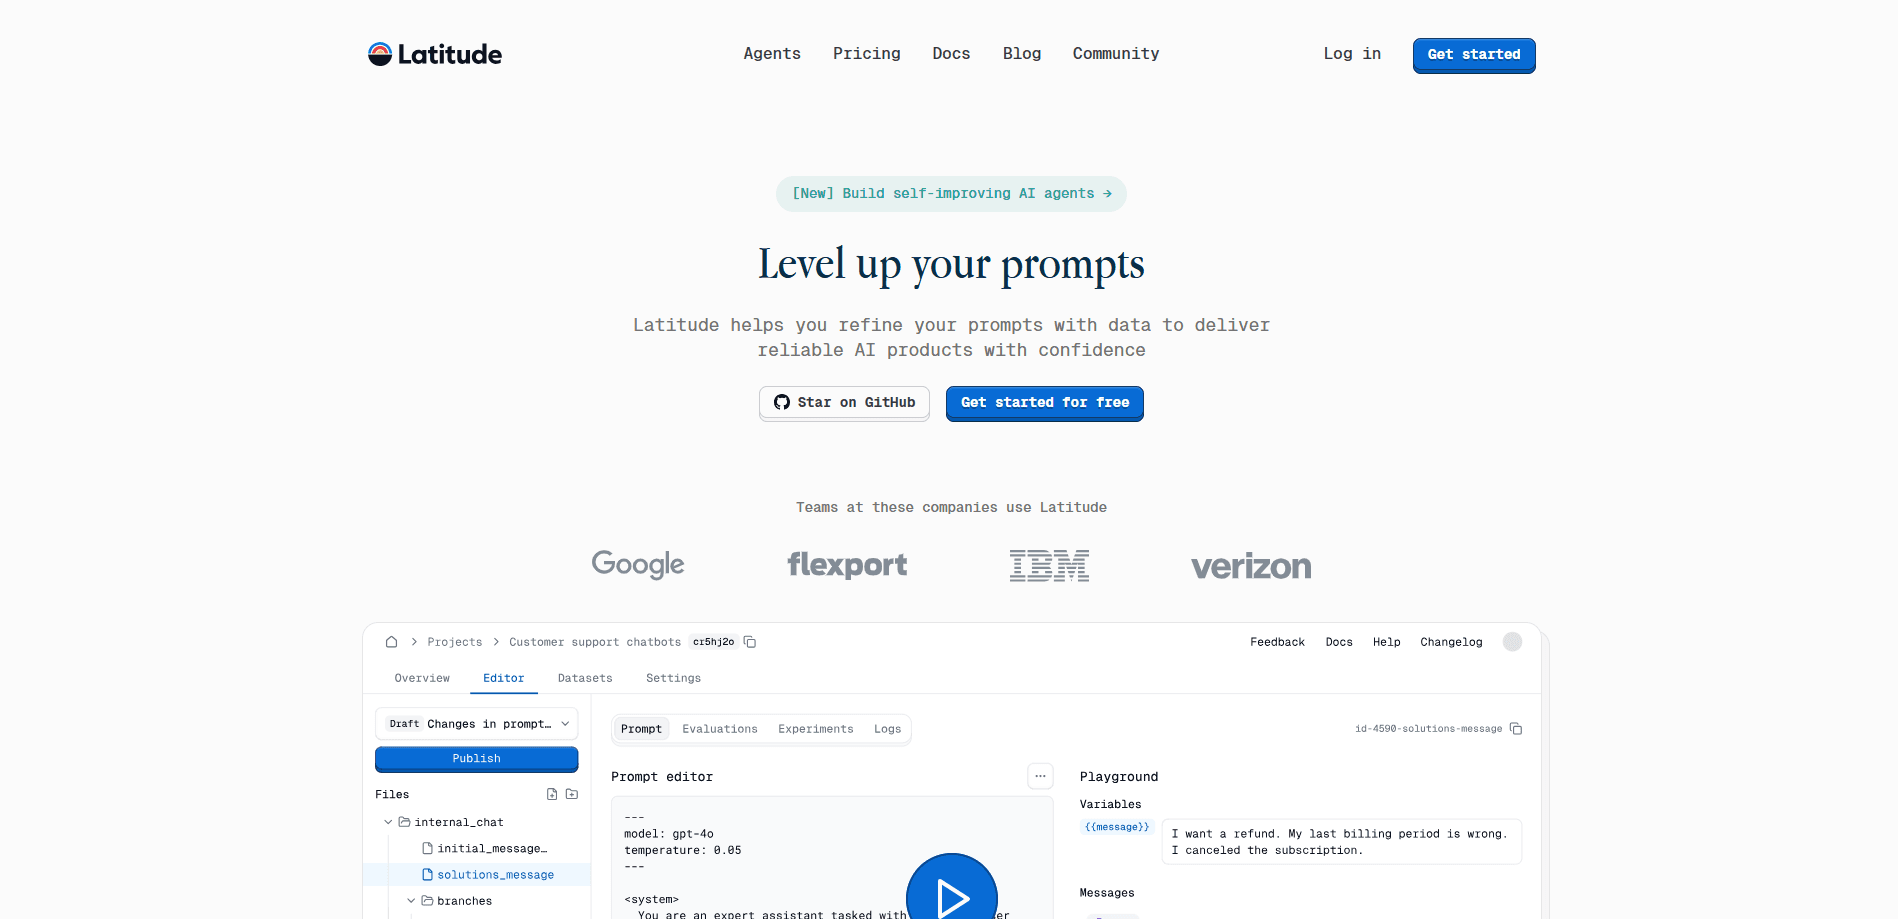
Latitude is an MIT-licensed AI agent observability platform for improving agents that are already running in production. It started as a prompt engineering platform for LLM evaluation, and today its center of gravity is LLM monitoring: watching what a live agent actually does and turning repeated failures into something a team can track and fix.
The product follows a loop it calls Observe, Understand, Refine. Latitude collects telemetry from your agent, then breaks each conversation into traces and sessions so you can see model calls, tool calls, tokens, latency, cost, and errors in one place. From there it clusters similar sessions by meaning, surfaces recurring failure patterns as named signals, and opens an alert when something new shows up or an old problem gets worse. As an LLM monitoring platform, that loop is the whole point: it is the observability layer between a running agent and the team responsible for it.
The catch is scope. Latitude looks at an agent that already exists. If you haven't built anything yet, there's nothing to monitor. It also asks for real production volume before it becomes useful, because behavior discovery and failure clustering lean on live traffic rather than a handful of test runs.
Getting Started
- Sign up at console.latitude.so and create a project for your agent.
- Install the Latitude SDK (npm or PyPI) or point your existing OpenTelemetry pipeline at Latitude.
- Send your first traces, which land as sessions you can open in the dashboard.
- Review traces, tool reliability, and cost, then let Behaviors and Signals surface recurring problems.
- Turn a signal into a monitor or evaluation, and optionally connect the Latitude MCP server so a coding agent can pick up the fix.
Product Information
A quick look at Latitude's pricing, supported platforms, and performance.
Best for
The users, tasks, and scenarios where this tool fits best.
Users
- AI engineers running agents in production
- Product teams shipping agent features
- QA and evaluation leads
- Self-hosting teams
Tasks
- Tracing multi-step agent runs
- Grouping recurring failures
- Watching cost per session
- Comparing traffic slices
- Automating the fix loop
Scenarios
- A support agent that keeps getting stuck
- A research agent burning budget
- An overnight release
Key features
OpenTelemetry-compatible tracing
Latitude ingests agent telemetry through its own SDK or any existing OpenTelemetry pipeline, using an open format rather than a proprietary one. Model calls, tool calls, retrieval steps, and nested execution all arrive as spans, and related spans roll up into sessions you can read as full multi-turn conversations. Teams already sending OTel data can point the pipeline at Latitude instead of rebuilding instrumentation.
Signals that turn failures into tracked problems
When traces fail repeatedly, Latitude groups them into signals: named, prioritized failure patterns with example traces, affected-user counts, and trends attached. Signals come from human annotations, automatic flaggers, evaluations, and custom checks, so a frustration spike or a tool error stops being a fragment in a log and becomes an issue with an owner.
Automatic issue discovery and alerts
Latitude watches incoming traffic and tells you when a new issue appears or an existing one gets worse. Alerts route to Slack, email, or webhooks, so the team hears about a problem before users file tickets. Each signal carries its failing traces and a trend, which makes the difference between a vague warning and something actionable.
Built-in flaggers and human annotations
The platform detects common failure categories on its own, including frustration, refusal, jailbreaking, tool errors, and empty responses. Reviewers can also leave inline feedback on any trace, span, or output, and that human judgment becomes structured signal the team can search, cluster, and fold into evaluations.
Dataset and evaluation management
Latitude builds golden datasets from validated production traces, one per issue, with versioning built in. Teams run evaluations and regression tests against those datasets, and evaluations generated from a signal keep scoring live traffic after a fix ships, which is how you confirm the fix actually held.
MCP server and coding-agent dispatch
A Model Context Protocol server gives coding agents access to the Latitude workspace, so they can read and manage projects without opening the dashboard. When a signal escalates, Latitude can dispatch Claude Code or Cursor with the full context, sample traces, and a deep link, and the agent implements the smallest correct fix and opens a pull request.
Enterprise-grade security and controls
Latitude is SOC 2 Type II certified and encrypts data in transit with TLS 1.2+ and at rest with AES-256. It supports SAML 2.0 single sign-on, GDPR tooling, audit logs, and data residency in Europe. Enterprise plans add fine-grained RBAC roles, on-premises or custom cloud deployment, and an uptime SLA.
Pros and cons
Pros
- The whole platform is open source under MIT, so teams can self-host it and audit exactly how agent data is handled.
- Traces, tool reliability, memory, and cost live in one place, which shortens the jump from "something broke" to "here is the failing step."
- Signals and automatic flaggers cut triage work by grouping recurring failures instead of leaving them as scattered logs.
- Coding-agent dispatch closes the loop, turning a detected issue into a pull request rather than a ticket someone still has to write.
- Pricing starts free with unlimited seats, so a small team can evaluate it before paying.
Cons
- It only helps once an agent is running in production, so early-stage projects have little to point it at.
- Behavior discovery and failure clustering need real traffic to be useful, which raises the bar for low-volume tools.
- The free tier keeps 30 days of data and 20K credits a month, so high-volume teams hit the paid Pro plan quickly.
- Adopting it means instrumenting your agent and wiring up telemetry, which is real setup work even with the fast OTel path.
Frequently asked questions
Latitude is an AI agent monitoring tool for agents that already run in production. It captures real traffic as traces and sessions, then surfaces failures, cost, and behavior patterns so teams can find and fix what is going wrong.
Related content
Explore related tools, skills, and articles for Latitude.
Latitude Alternatives

Odyssey 3
Odyssey · OtherOdyssey-3 is Odyssey's foundation world model. It simulates physics in real time, turns a prompt into an interactive environment, and adapts to robots, cars and games.

JarvisCore
Prescott Data · Coding · Productivity · OtherJarvisCore is an open source Python runtime where AI agents work as equal peers on an agent mesh, claim tasks from a shared ledger, and reach external services through a zero-trust broker.
Clef
Cloudflare · Business · OtherClef is Cloudflare's open-source decision model for Workers AI. It returns calibrated probabilities for typed questions, not generated text, so agents can classify, route, and act fast.