
LocaleScan
Omer Lev · Business
LocaleScan is a browser based map tool that scans the area around a property, covering crime, environmental hazards, economic stability and amenities before you buy or rent.
About LocaleScan
What Is LocaleScan
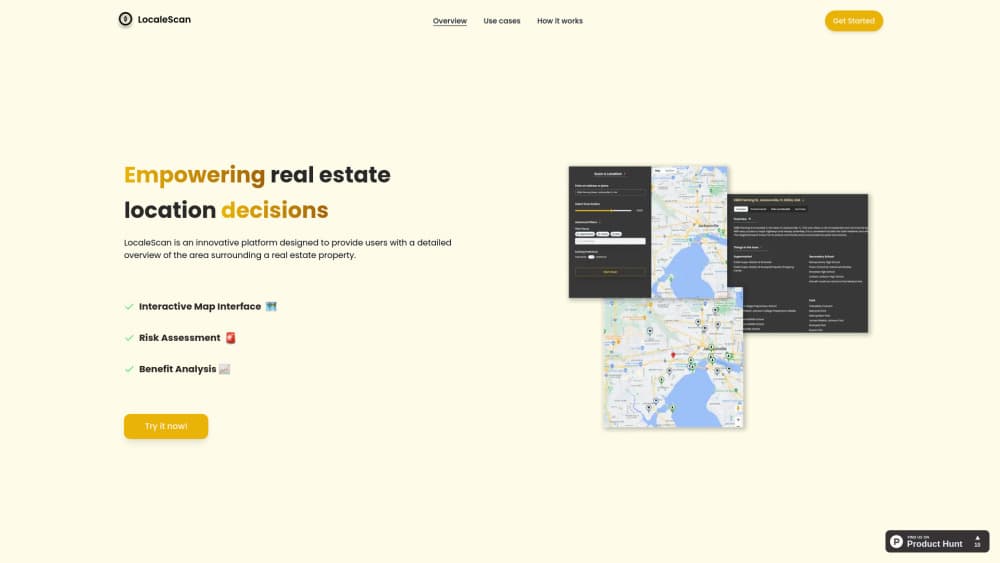
LocaleScan is a neighborhood analysis tool built for real estate location analysis. You drop a pin on a property, set a radius, and the site returns a readout of what sits inside that circle: crime statistics, noise and pollution sources, unemployment and growth signals, plus the shops, schools and daycare centers nearby.
It was built by Omer Lev as an independent web project. The pitch is simple. Most listing pages tell you about the house. Almost none tell you what the six blocks around it feel like at 10 p.m. on a Tuesday.
The limits matter as much as the features. There's no mobile app, no account tier to upgrade, and no published pricing page. Results lean on public data sets, so a rural address or a market with thin open data will produce a shorter report than a dense city neighborhood. Treat the output as a first pass for property due diligence, not a substitute for walking the street or pulling official records.
Getting Started
- Open localescan.com in a desktop or mobile browser. No signup screen blocks the way.
- Enter the address or drop a marker on the property you want to check.
- Set the scan radius around the pin. A tighter circle gives block level detail, a wider one pulls in the wider district.
- Read the results by category: safety, environment, economy, amenities, schools and transport.
Product Information
A quick look at LocaleScan's pricing, supported platforms, and performance.
Best for
The users, tasks, and scenarios where this tool fits best.
Users
- Home buyers
- Renters
- Real estate investors
- Real estate agents
Tasks
- Comparing two neighborhoods
- Screening environmental risk
- Checking family suitability
- Sanity checking a listing
Scenarios
- Relocating to an unfamiliar city
- Early stage deal review
- Explaining a location to a client
Key features
Interactive Map Interface
The map is the product. You pan, zoom and switch layers over the property rather than reading a long text report. Each layer answers a different question, so you can look at safety first and amenities second without reloading anything.
Typed Location Markers
Places are drawn with distinct icons instead of identical pins. A school looks like a school, a hospital looks like a hospital. That sounds cosmetic until you're scanning a ten minute walk radius and need to count three kinds of services at a glance.
Crime and Safety Data
The safety panel reports crime statistics for the surrounding area. Numbers alone won't tell you whether a street feels safe, but they do flag a block that looks calm in photos and busy in the police log.
Environmental Hazard Screening
Noise and pollution levels, distance to highways, and nearby industrial sites all show up here. For anyone sensitive to traffic noise or air quality, this is the section worth checking before a viewing, not after.
Economic Stability Signals
Unemployment rates and growth indicators give a rough read on how a district is trending. A neighborhood with falling opportunity and rising vacancy tells a different story than one adding jobs, and the area risk assessment gets sharper when you read both together.
Amenities, Schools and Childcare
Restaurants, cafés, gyms, supermarkets, public and private schools, colleges and daycare centers are mapped by category. This is the part most people use first, because daily convenience is easier to judge than abstract risk scores.
Pros and cons
Pros
- Fast first pass on any address, with no account and no paywall in the way.
- Combines safety, environment, economy and amenity data on one screen instead of four tabs.
- Radius control lets you separate block level detail from district level context.
- Clear use case framing for buyers, renters, investors and planners, so you know what each panel is for.
Cons
- Coverage tracks public data, so rural areas and markets with weak open records return thin reports.
- Browser only. There's no iOS or Android app for checking an address while you're standing in front of it.
- The interface is spare, and at least one reviewer on an AI tool directory described it as close to unfinished, which means fewer filters and export options than a paid analytics suite.
Frequently asked questions
It gives you a location report for a property: crime figures, environmental hazards, economic indicators, amenities and schools within a radius you set. People use it to compare neighborhoods before buying, renting or investing.
Related content
Explore related tools, skills, and articles for LocaleScan.
LocaleScan Alternatives

Knocket
Knocket (Tencent RTC team) · Productivity · Business · ChatbotKnocket is a free live chat and contact page tool that lets visitors message you from your website, app, or a shareable link, with every reply handled from Telegram or one inbox.

shippedit.me
Krawlup · Marketing · Businessshippedit.me now redirects to Krawlup, a web platform that audits SEO, AEO and page speed every week, then hands the fixes to AI coding agents over MCP.

Ayven
Alknoma · Productivity · BusinessAyven is an AI control centre by Alknoma that turns a plain-language goal into a dated plan, hands the work to your people and AI agents, and asks for your approval only when the call is yours.