

LogStitch
LogStitch · Coding
LogStitch is a native macOS app that turns raw Amazon CloudWatch Logs into readable AWS Lambda invocations. Instead of scrolling a timestamp-sorted river of interleaved log lines, it reads the request ID on each line and weaves the events from one execution back together, across every function an incoming request touched. It runs locally, keeps your AWS credentials in the macOS Keychain, and adds built-in analytics plus a local MCP server so AI assistants can query stored logs while you debug. It's macOS only. Near the end of the piece we explain who that suits and who it leaves out.
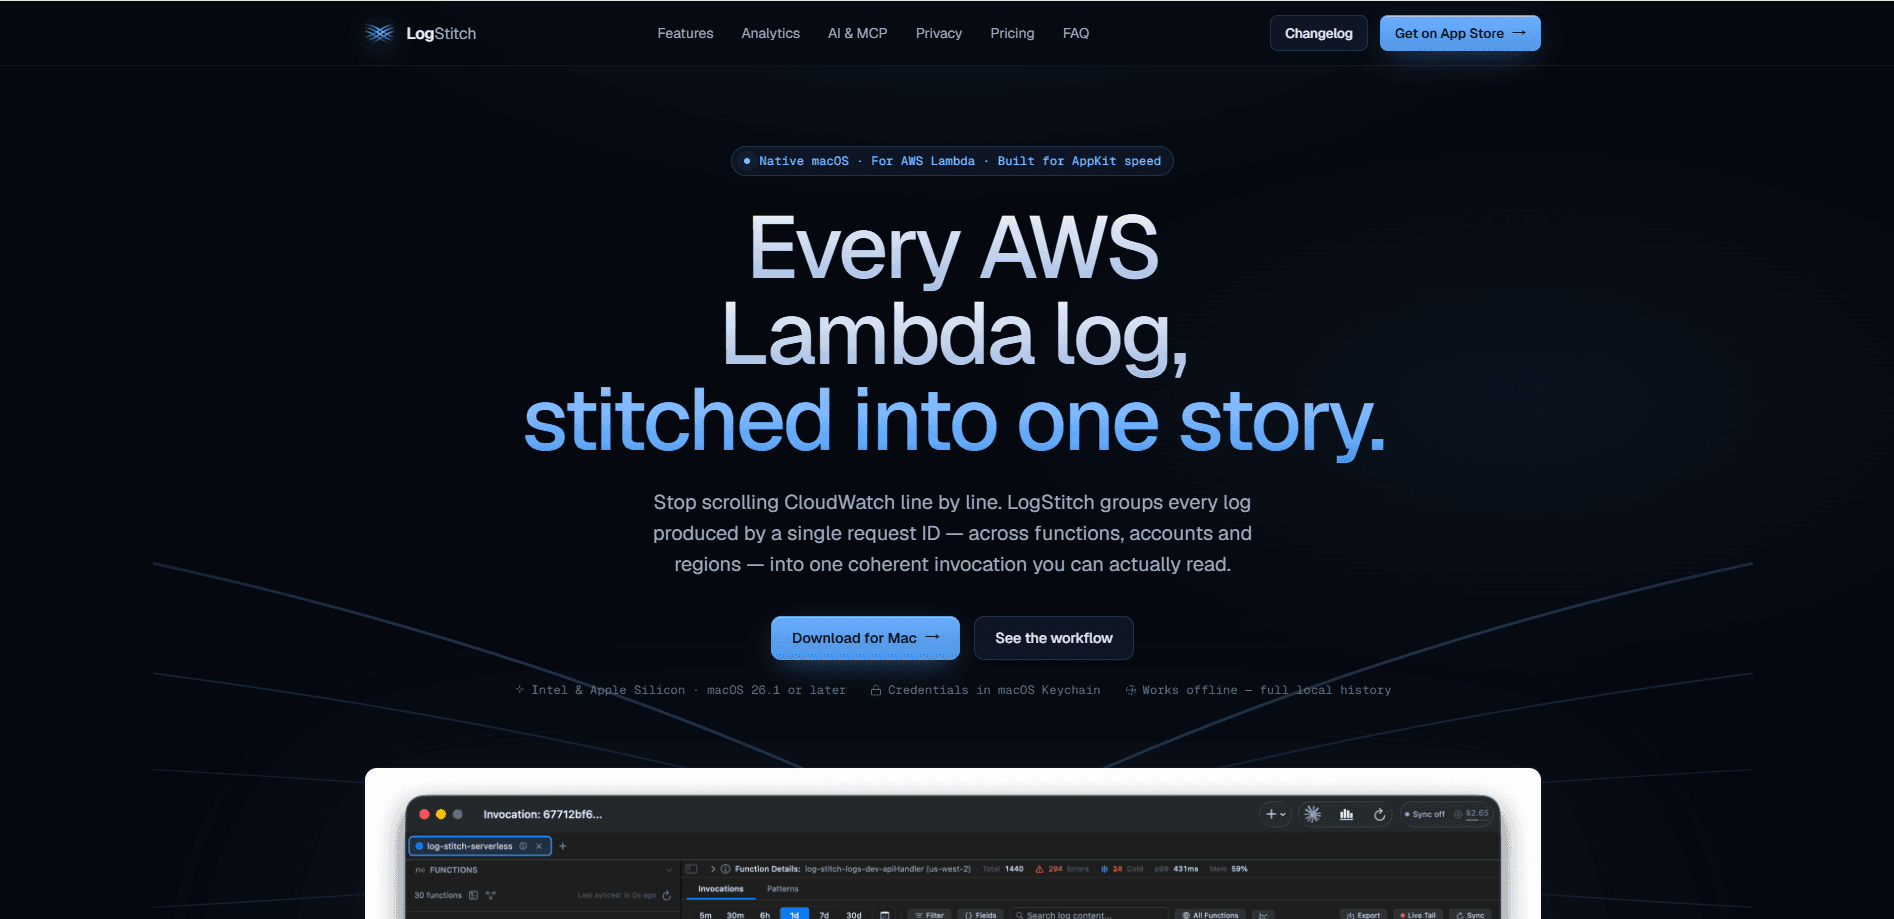
About LogStitch
What Is LogStitch
CloudWatch doesn't store a Lambda invocation as a unit. It stores a flat, time-ordered stream of log events, and when your function runs concurrently, the events from every simultaneous execution get mixed into the same river. LogStitch undoes that. It matches each platform line to its request ID, rebuilds the invocation boundary, and then attributes your own log lines to whichever execution was open when they were written. What was a wall of noise becomes a list of individual requests, each one legible on its own. Big difference.
The app is aimed at people who already live in AWS. It pulls log events straight from your account to your Mac, groups them by request ID, and lets you follow a single request across the functions it passed through. On top of the stitching it adds p99 duration trends, cold-start scatter, memory right-sizing and cost projection, so you can see whether a change actually helped instead of guessing. So what does that look like in practice?
The biggest limitation is scope. LogStitch is a macOS app for AWS Lambda, and that's all it does. It won't help you with EC2, containers or ECS, and there's no Windows or Linux build. It also needs a reasonably current macOS version, so an older Mac may simply be out of the question. Pricing for the desktop app isn't published on the site, which makes it hard to budget for before you try it.
Getting Started
- Download the macOS app and check that your Mac meets the stated system requirement, since the build needs a recent macOS release and runs on both Intel and Apple Silicon.
- Pick the AWS profile you want to read from when the app opens. It uses your existing credentials and stores them in the macOS Keychain rather than in a config file.
- Let LogStitch pull log events for the functions in that account. The function list loads from a local cache, so large accounts open quickly.
- Filter by runtime, region or health, then open any invocation to read its log lines grouped by request ID.
- Search a request ID or correlation header to follow that single request across every function it touched, laid out as swim lanes.
Product Information
A quick look at LogStitch's pricing, supported platforms, and performance.
Best for
The users, tasks, and scenarios where this tool fits best.
Users
- Backend and serverless developers
- Teams debugging production incidents
- Developers using AI coding assistants
Tasks
- Untangling concurrent invocations
- Tracking a request across services
- Cold-start analysis
- Cost review
Scenarios
- A production outage where the error is buried under concurrent traffic
- Right-sizing Lambda memory after a traffic change
- Debugging a fresh deployment
Key features
Request-ID stitching
This is the core of the app. Every platform line carries a request ID, so LogStitch can match INIT_START, START, END and REPORT into a single invocation boundary, then attribute your own log lines to the execution that was open at that moment. Fifteen messy lines become one invocation. It works locally and finishes in milliseconds.
Cross-function correlation
One function rarely holds a whole request. LogStitch follows a request across every Lambda it touched and lays the hops out as swim lanes with propagation latency between them. You can search by request ID or by a correlation header you already emit, which means you don't have to change your logging to get the benefit.
Built-in analytics
The app ships its own dashboards rather than pushing you to a separate tool. You get p99 duration trends, cold-start scatter, memory right-sizing and cost projection in one place. No third-party setup needed. The memory view uses the memory-versus-duration curve instead of headroom alone, which tends to give a more useful right-sizing number.
Anomaly detection
Error patterns are clustered automatically, and statistical anomalies on duration, errors, cold starts and cost surface on their own. That matters most during an incident, when you don't yet know what you're looking for. Fewer manual greps, more signal. Not ideal for every team, but a real time saver when it clicks.
Local MCP server
A built-in MCP server (Model Context Protocol) exposes your stored invocations to AI assistants running on the same Mac. It binds to 127.0.0.1 only and answers from log data already on disk, so your assistant never receives AWS credentials and never talks to AWS. Loopback only. It exposes 21 tools covering invocations, errors, patterns, performance, cost and full-text search.
Local-first by design
Logs are fetched straight from your AWS account to your Mac, and credentials stay in the macOS Keychain, used only by LogStitch itself. Nothing transits a vendor, and the app works offline against your full local history. That matters for teams with strict data rules. If log data leaving your network is a blocker, this design is the reason to consider it.
Pros and cons
Pros
- Turns interleaved CloudWatch streams into per-invocation views, which is the actual problem most Lambda developers have.
- Runs entirely on your Mac with credentials in the Keychain and no vendor in the path.
- Pairs stitching with analytics, so duration, cold-start and cost questions don't need a second tool.
- The local MCP server lets AI assistants query logs without ever handing over AWS access.
- Handles large accounts: functions load from a local cache and stay filtered by runtime, region or health.
Cons
- macOS only, and it needs a recent macOS version, so Windows and Linux users are out.
- Lambda only. If you also run EC2, ECS or containers, LogStitch won't cover those logs.
- App pricing isn't published on the site, so you can't budget for it before you try.
Frequently asked questions
It groups Amazon CloudWatch Logs by request ID so each AWS Lambda invocation reads as one unit instead of a jumble of interleaved lines. It also correlates a request across the functions it touched and adds analytics on top.
Related content
Explore related tools, skills, and articles for LogStitch.
LogStitch Alternatives
Forefront
Forefront · CodingForefront is a web platform for building with open-source AI. It lets you fine-tune leading open-source language models on your own data, evaluate how they perform, and run them through an API or export them to host yourself. Developers who want the convenience of a closed-source platform but insist on owning their models and data are the target audience here.

Startkit
StartKit.AI · CodingStartkit is a boilerplate for building AI SaaS and AI wrapper products. Think of it as an AI startup boilerplate with the boring parts already wired up: authentication, Stripe and Lemon Squeezy payments, usage limits, transactional email, and an AI API starter that talks to OpenAI, Anthropic, Groq, or Llama. You clone the repo, set your price, and start on the part of your product that people actually pay for. It's Next.js under React and Tailwind, so most of the boilerplate code already feels familiar.
Testim
Tricentis · CodingTestim is an AI-powered test automation platform for building and running end-to-end tests across web, mobile, and Salesforce applications. It leans on machine learning to keep tests stable when an interface changes, so teams spend less time fixing broken selectors. Not bad for an automated testing tool you can start using today. You create tests by recording actions in a browser, then optionally add JavaScript when you need more control. It's a solid pick for busy QA teams.