

MacroMicro
MacroMicro · Business
MacroMicro is a macroeconomic data platform that turns global economic indicators into dynamic charts, ETF tools, and AI research for investors. It has a free tier, with paid plans from $25/mo.
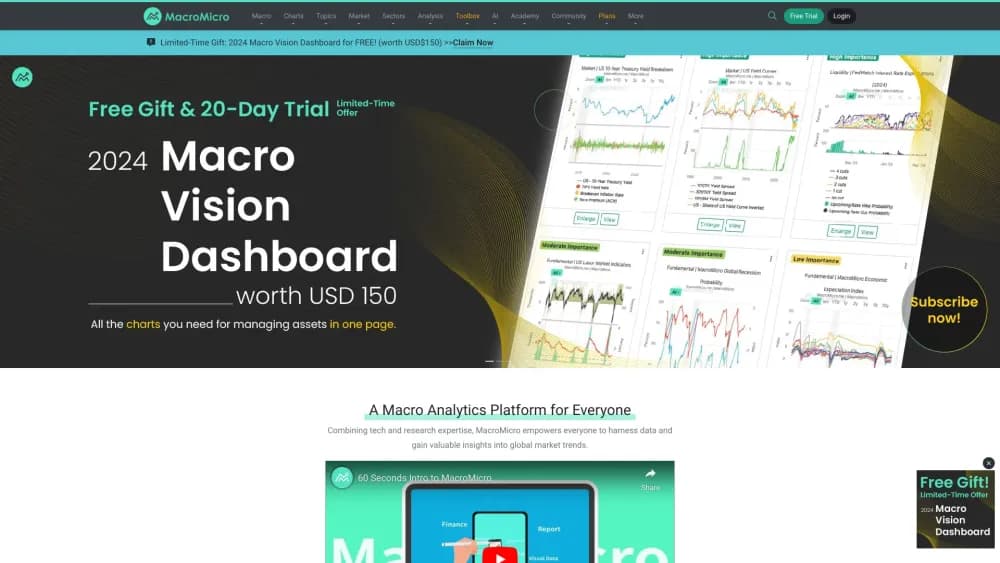
About MacroMicro
What Is MacroMicro
MacroMicro is a web platform built by a Taiwan startup that collects economic data from around the world and plots it on interactive charts. The name comes from macroeconomics plus microeconomics, and the idea is simple: pull hard-to-find indicators into one place so regular investors can read a business cycle without paying for a Bloomberg terminal.
You get economic cycle charts for inflation, growth, liquidity, interest rates, and trade across more than 100 countries, plus proprietary indicators the team builds itself. The platform covers stocks, forex, bonds, ETFs, commodities, and crypto, so you can compare how different markets move against the same macro backdrop.
The main limits are scope and workflow. MacroMicro is a research and reference tool, not a broker or trading terminal, so it does not place orders or sync with your portfolio. The deepest features, like backtesting, the U.S. earnings database, and AI summaries, sit behind the higher paid tiers.
Getting Started
- Create a free account on the MacroMicro site to browse public charts and dashboards.
- Pick a subscription tier if you need unlimited charts, backtesting, or the earnings database.
- Search an indicator or region and drop charts into a personal dashboard you can save and revisit.
- Use the Toolbox to add calculations, seasonality views, or a comparison against a second series.
- Sync the global economic calendar to Google or Apple Calendar, or pull data through the API on eligible plans.
Product Information
A quick look at MacroMicro's pricing, supported platforms, and performance.
Best for
The users, tasks, and scenarios where this tool fits best.
Users
- Individual investors
- FICC and multi-asset traders
- Macro-curious beginners
- Research analysts
Tasks
- Macro investment research
- ETF research
- Economic event tracking
- Institutional positioning review
- Earnings research
Scenarios
- Building a monthly macro dashboard
- Preparing an asset allocation view
- Following a central bank cycle
- Teaching or explaining macro
Key features
Dynamic economic charts
Every indicator loads as an interactive chart you can zoom, compare, and annotate. There are millions of data points across more than 100 countries and 48-plus asset fundamentals, which is the core reason people come here instead of scraping sources by hand.
Proprietary cycle indicators
Beyond raw data, MacroMicro publishes its own fundamental indices and cycle charts that try to time where an economy sits. These are the team's own models, so treat them as one informed view rather than a neutral reading.
Powerful Toolbox
Paid members get charting tools for line, bar, and stacked views, plus seasonality and backtesting. This is where the platform stops being a chart library and starts acting like a small research workstation.
ETF screener and comparator
You can screen ETFs by theme and strategy, compare them side by side, and run a reverse lookup to see which funds hold a specific stock. It fits the common question of how to get exposure to a theme without picking single names.
Global economic calendar
The calendar lists upcoming data releases and central bank decisions, and annual members can sync it straight into Google or Apple Calendar. It keeps release dates in the same place you already plan your week.
AI research and earnings summaries
Higher tiers add MM AI tools and AI-generated summaries of U.S. earnings calls, alongside an industry intelligence hub. The aim is to shorten the read time on dense disclosures, but the output still needs a human check.
Data API and business plans
Beyond individual plans, MacroMicro offers an API tier with thousands of indicators and a business plan for teams, including commercial licensing and custom data services. That makes it usable inside a firm's own tooling, not just the browser.
Pros and cons
Pros
- Affordable alternative to institutional terminals: full macro access costs a small fraction of a Bloomberg seat.
- Genuinely global coverage: 100-plus countries with stocks, forex, bonds, ETFs, commodities, and crypto on the same platform.
- Charts designed for non-experts: the visual style makes a business cycle readable without a finance degree.
- Real toolkit, not just visuals: backtesting, seasonality, and ETF comparison add analytical depth.
- Free tier and API options: you can start at no cost and scale to programmatic access later.
Cons
- Not a trading platform: there is no broker sync or order execution, so you still need a separate brokerage.
- Best features are paywalled: unlimited charts, the earnings database, and AI tools sit on the higher tiers.
- Company-level depth is thinner: the platform leans macro and thematic, so single-stock fundamental analysis is limited.
- Learning curve on macro: new users can feel lost until they understand how the indicators relate.
Frequently asked questions
It has a free tier for browsing public charts and dashboards, but unlimited charts, backtesting, and the earnings database require a paid plan. Some plans also offer a short trial.
Related content
Explore related tools, skills, and articles for MacroMicro.
MacroMicro Alternatives

Knocket
Knocket (Tencent RTC team) · Productivity · Business · ChatbotKnocket is a free live chat and contact page tool that lets visitors message you from your website, app, or a shareable link, with every reply handled from Telegram or one inbox.

shippedit.me
Krawlup · Marketing · Businessshippedit.me now redirects to Krawlup, a web platform that audits SEO, AEO and page speed every week, then hands the fixes to AI coding agents over MCP.

Ayven
Alknoma · Productivity · BusinessAyven is an AI control centre by Alknoma that turns a plain-language goal into a dated plan, hands the work to your people and AI agents, and asks for your approval only when the call is yours.