

Middleware Observability Platform
Middleware · Coding
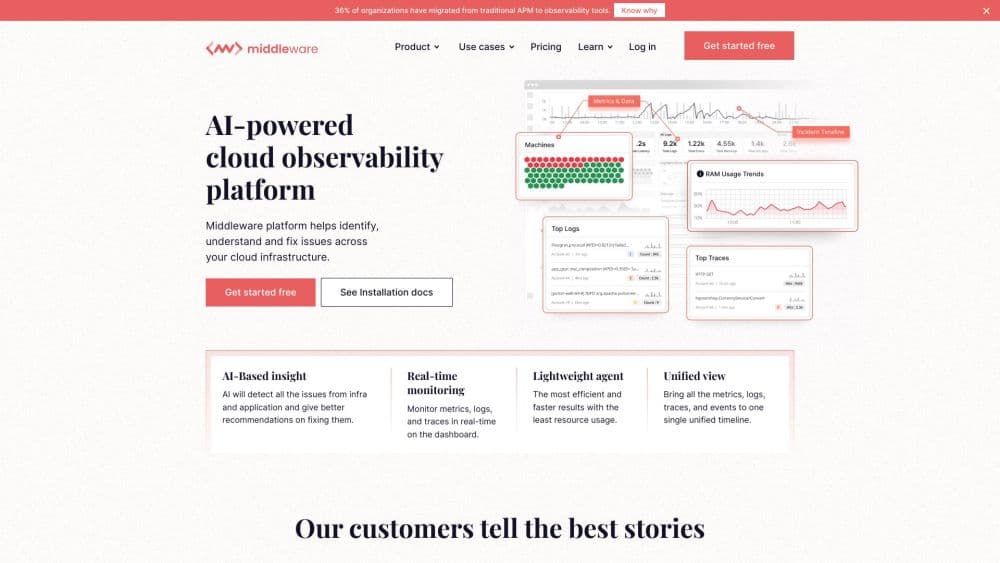
Middleware is a cloud observability platform that pulls logs, metrics, traces, and real user sessions into one timeline, then uses an AI agent to find the root cause of incidents and suggest fixes.
About Middleware Observability Platform
What Is Middleware
Middleware Observability Platform is a cloud monitoring service built for engineering teams that run applications across Kubernetes, virtual machines, and managed databases. Instead of buying a metrics tool, a log tool, and an APM tool separately, you install one agent and get all of them on the same screen. That single timeline matters when something breaks: a slow API call, an error log, and a user session replay can sit side by side with a shared request context.
The company behind it is Middleware, founded in 2022 by engineers who had worked at Netflix, DigitalOcean, Google, and Cisco. It collects data through host agents, language SDKs, and third party integrations, and it speaks OpenTelemetry, so existing collectors and agents from other vendors can feed it without a full migration. Pricing is usage based, and the platform's selling point is the cost of ownership rather than a huge feature catalog aimed at enterprise procurement.
The limits are worth knowing up front. It's a hosted SaaS product, so the data leaves your network unless you pay for the bring your own cloud option. Deep enterprise compliance workflows and long retention windows belong to the custom contract. And the AI agent is newer than the core monitoring stack, so teams with strict change management will want to review its automatic pull request feature before switching it on.
Getting Started
- Create an account at app.middleware.io and sign in with Google, GitHub, email, Okta SSO, or Microsoft Entra ID.
- Open the installation page and copy the MW_API_KEY and MW_TARGET values for your project.
- Pick your stack: a Kubernetes DaemonSet, a host agent for Linux, an SDK for Java, Python, Node.js, or another runtime, or a third party integration such as AWS, Azure, Prometheus, or Datadog.
- Deploy the agent and confirm data starts flowing into the dashboard within a few minutes.
- Build views and alerts around the signals that matter to your team, then switch on OpsAI detection to catch anomalies you did not write a rule for.
Product Information
A quick look at Middleware Observability Platform's pricing, supported platforms, and performance.
Best for
The users, tasks, and scenarios where this tool fits best.
Users
- DevOps and SRE teams
- Startup engineering teams with tight budgets
- Backend developers working on LLM features
Tasks
- Finding the root cause of a slow endpoint
- Keeping Kubernetes clusters healthy
- Watching database queries
- Checking whether an API is up from outside your network
Scenarios
- A production incident at 2 a.m.
- A launch week traffic spike
- A monthly cost review
Key features
OpsAI Agent for Detection and Remediation
OpsAI watches applications, infrastructure, databases, containers, logs, and LLM apps at the same time, then correlates what it finds across those signals. The point is the step after alerting: it points to a likely root cause and proposes a fix, and it can open a pull request with the change. Error detection itself costs nothing, and root cause analysis is billed by token, so you can keep the alerts on even when you don't want the AI step on every incident.
Application Performance Monitoring
The APM module records spans in real time and follows a request from an API endpoint down into the databases it touches. Continuous profiling shows which function is burning CPU, which answers a different question than a slow trace alone: the trace says where the time went, the profile says which code spent it. Traffic maps and dependency views help when you need to explain an outage to someone outside engineering.
Log Monitoring With QueryGenie
Logs come in from any JSON source, so you don't have to reshape your output before sending it. You can search by attribute, fuzzy match, or regular expression, and pause and resume live view while a deploy is running. QueryGenie turns a plain English request into a query, which helps people who don't write structured queries every day. Sensitive data masking and custom attribute extraction happen before storage, which matters if your logs carry customer records.
Infrastructure and Kubernetes Monitoring
Auto instrumentation covers hosts, Kubernetes clusters, Linux nodes, and cloud services without a script per machine. You see cluster health, CRDs, and network policies in one view, along with ECS level detail for containerized workloads. Correlating a CPU spike with the application latency it caused is the workflow the product was designed around, and it's the part most teams notice first.
Real User Monitoring and Session Replay
Real user monitoring records what actual visitors experience in web and mobile apps, then ties a slow page load to the backend trace that caused it. Session replay lets you watch the session next to the network data instead of asking a user to describe what they saw. Privacy controls anonymize fields and limit what gets captured, which keeps the feature usable in products that hold personal data.
Synthetic and Browser Testing
Synthetic monitoring and browser testing share this module. Synthetic checks run HTTP, UDP, DNS, and WebSocket requests from multiple locations on a schedule, with full request and response detail. Browser tests script a user journey, such as signing in and checking out, and run it across browsers and device profiles. Together they cover the gap that server side monitoring can't see: whether the service is reachable and usable from the outside.
Database and LLM Observability
Database monitoring digs into query level detail across MySQL, PostgreSQL, MongoDB, Cassandra, and Aurora, tracking CPU, memory, disk, and throughput alongside the queries themselves. The LLM module tracks latency, token usage, cost, response quality, and errors for prompts, agents, and multi step workflows, then connects an expensive or failing AI call to the trace and session that produced it.
Pros and cons
Pros
- One agent and one screen for logs, metrics, traces, infrastructure, RUM, synthetics, and LLM data, which removes the usual tool switching during an incident.
- OpenTelemetry based collection means existing collectors, Datadog agents, and Prometheus setups can feed data without ripping out what you already run.
- Usage based pricing starts at a free tier with 100GB of data and unlimited users, so cost scales with telemetry rather than with headcount.
- The data pipeline lets you drop noisy log sources before they're stored, which keeps both the bill and the search results under control.
- OpsAI's error detection is free and its suggested code changes go through a pull request, so reviewers stay in the loop.
Cons
- It's a hosted platform, so data leaves your network unless you pay for the bring your own cloud option on a custom contract.
- The free tier keeps 14 days of data and the pay as you go plan defaults to 30 days, which is short for teams that need to look back a year after an audit.
- Automatic remediation and code change suggestions carry real risk in regulated environments, so many teams will leave them turned off at first.
- LLM observability is a newer module than the core APM and log tooling, so expect fewer deep integrations than the longest running competitors offer.
Frequently asked questions
Middleware monitors infrastructure, containers, Kubernetes, application traces, logs, databases, real user sessions, synthetic checks, and LLM applications. All of it lands on one timeline, linked by request context, so you can move from a user complaint to the exact query that caused it.
Related content
Explore related tools, skills, and articles for Middleware Observability Platform.
Middleware Observability Platform Alternatives

Base Code
Base44 (Wix) · Coding · ProductivityBase Code is a shared cloud development environment from Base44. Teammates describe changes to an existing GitHub codebase in chat, preview them live and send them back as pull requests.

Google EmbeddingGemma 2
Google DeepMind · Writing · Image · CodingGoogle EmbeddingGemma 2 is a 740M-parameter open model that turns text, code, images, audio, and video frames into vectors in one 768-dimension space, running on phones and laptops.

GitGlow
GitGlow · Coding · ProductivityGitGlow is a local-first desktop Git client that lets independent developers review their own code and their AI agents' changes in one place before shipping.