

NeoBase
Bhaskar (open-source project) · Other
NeoBase is an open-source AI copilot for databases that lets you query, visualize, and manage data through natural language instead of handwritten SQL.
About NeoBase
What Is NeoBase
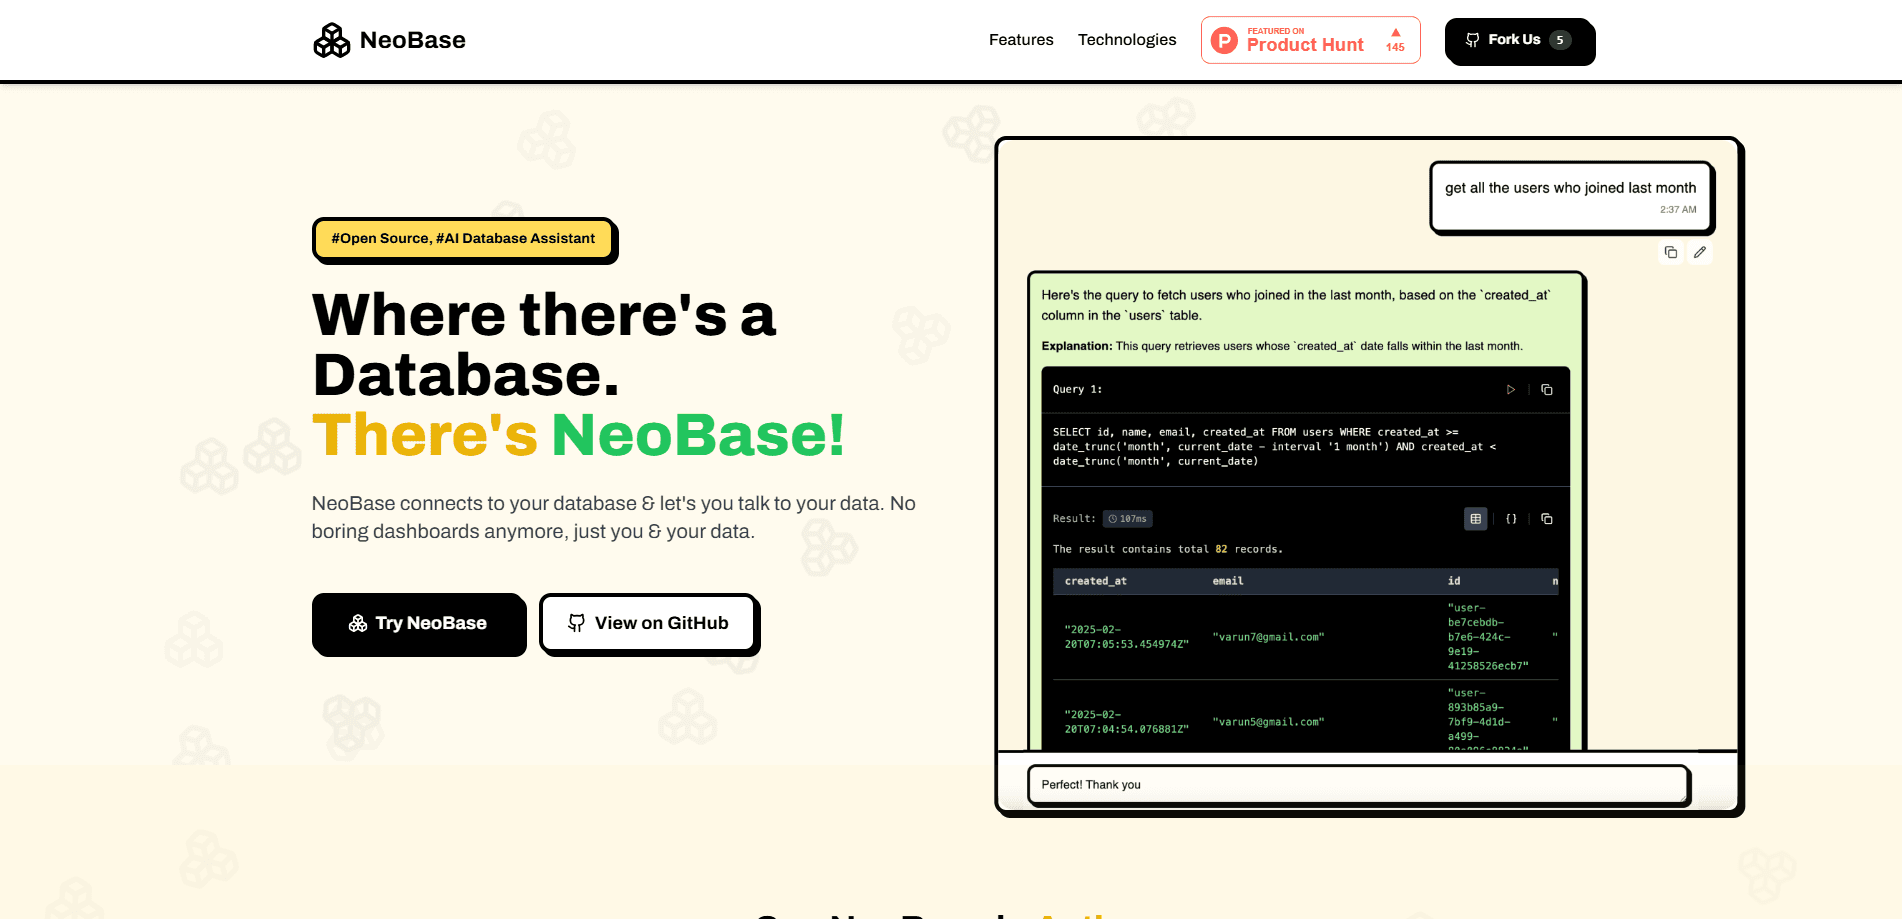
NeoBase is an AI database copilot that sits on top of the databases you already run, so you can chat with your database instead of writing queries by hand. You connect a data source, then ask questions in plain language. The tool turns each request into a real query, runs it, and shows the results. It handles SQL engines like PostgreSQL and MySQL, NoSQL stores like MongoDB, and flat files such as CSV and Excel.
The pitch is speed for anyone who needs an answer but doesn't live in a query console. A support engineer checking why a user can't log in, a founder browsing signups, or an analyst verifying a hunch can all skip the syntax and go straight to the data. The AI query generator writes the statement for you, which is the whole point. Because the project is an open source database tool that you self-host, your connection strings and records never have to leave your own servers.
The limits matter too. NeoBase is a young project, so you won't find enterprise governance, audit trails, or per-role permissions. You bring your own model API key or a local Ollama model, and you pay for that usage separately. It also writes and executes queries against live data, so you should point it at a read-only account until you trust it.
Getting Started
- Deploy NeoBase on your own machine or server by following the official setup guide, then open the web client in your browser.
- Sign in with the admin credentials set through environment variables, generate a signup secret, and create your user account.
- Add a database connection from the sidebar by entering the host, port, username, and password for PostgreSQL, MySQL, MongoDB, or another supported source.
- Set an API key for OpenAI, Gemini, Claude, or a local Ollama endpoint so the copilot has a model to call, and pick the model you want per message.
- Type a question like "show me all users" and review the generated query, the paginated results, and any chart the AI builds from the output.
Product Information
A quick look at NeoBase's pricing, supported platforms, and performance.
Best for
The users, tasks, and scenarios where this tool fits best.
Users
- Software developers
- Data analysts
- Product and support teams
Tasks
- Ad-hoc data exploration
- Building dashboards
- Query tuning
- Schema work
Scenarios
- Debugging a live issue
- Reviewing a dataset before a meeting
- Working with Google Sheets data
Key features
Natural Language Queries with Agentic Tool Calling
You describe what you want and the copilot writes the query, runs it, reads the result, and refines its approach until the answer makes sense. This loop matters because a single pass often misses the right table or filter. The AI keeps adjusting instead of handing you a broken statement.
AI-Generated Dashboards
Ask for a dashboard and NeoBase analyzes your schema to build one with widget types such as stat cards for KPIs, data tables for records, and line, bar, pie, and area charts. It also covers gauge, bar gauge, heatmap, and histogram widgets for pattern and distribution work. You can export dashboards as JSON, regenerate variants, and copy them across chats.
Multi-Database Support
NeoBase connects to PostgreSQL, MySQL, MongoDB, ClickHouse, Yugabyte, and more from a single interface. Redis, Cassandra, and Neo4j are on the roadmap rather than shipped. Teams that run a mix of engines get one chat window instead of juggling several clients.
AI-Generated Visualizations
Every query result can turn into a chart. The AI detects data types, picks a sensible chart type, and maps columns so dates land on the X-axis and metrics on the Y-axis. Database visualization stops being a separate task you do in another tool. It samples and groups large result sets, so charts stay readable even past 100,000 rows. If you run a PostgreSQL AI assistant setup or lean on a MongoDB AI chat, the same mapping logic applies.
CSV and Google Sheets Support
You can upload CSV or Excel files and query them like a database, with AES-GCM encryption on stored spreadsheets. A separate OAuth integration connects Google Sheets directly. This makes it practical to blend a spreadsheet export with live tables in one session.
Self-Hosted and Open Source
NeoBase runs on your own infrastructure under the MIT license, and you can read or fork the code on GitHub. As a self-hosted AI database, it keeps your records on hardware you control. You choose the model provider, from cloud APIs to a local Ollama install. That control is the main reason privacy-conscious teams pick it over a hosted alternative.
Pros and cons
Pros
- Open source and self-hosted, so your data stays on your own servers
- Supports both SQL and NoSQL engines plus spreadsheets in one interface
- AI-generated dashboards and charts save manual visualization work
- Mixes cloud models and local Ollama models without code changes
- Free to run, with cost limited to whatever model usage you incur
Cons
- Young project with no enterprise governance, audit logs, or role-based permissions yet
- Requires you to supply your own LLM API key or a self-hosted model, which adds cost and setup
- The AI can write and run queries against live data, so it needs a read-only account or careful review before production use
- Redis, Cassandra, and Neo4j are announced but not available, so some stacks won't fit today
Frequently asked questions
NeoBase is used to query, analyze, and visualize data through chat instead of writing queries by hand. It turns plain-language questions into real database queries and shows the results as tables or charts.
Related content
Explore related tools, skills, and articles for NeoBase.
NeoBase Alternatives

Odyssey 3
Odyssey · OtherOdyssey-3 is Odyssey's foundation world model. It simulates physics in real time, turns a prompt into an interactive environment, and adapts to robots, cars and games.

JarvisCore
Prescott Data · Coding · Productivity · OtherJarvisCore is an open source Python runtime where AI agents work as equal peers on an agent mesh, claim tasks from a shared ledger, and reach external services through a zero-trust broker.
Clef
Cloudflare · Business · OtherClef is Cloudflare's open-source decision model for Workers AI. It returns calibrated probabilities for typed questions, not generated text, so agents can classify, route, and act fast.