

Opaline
Opaline · Coding · Productivity · Business
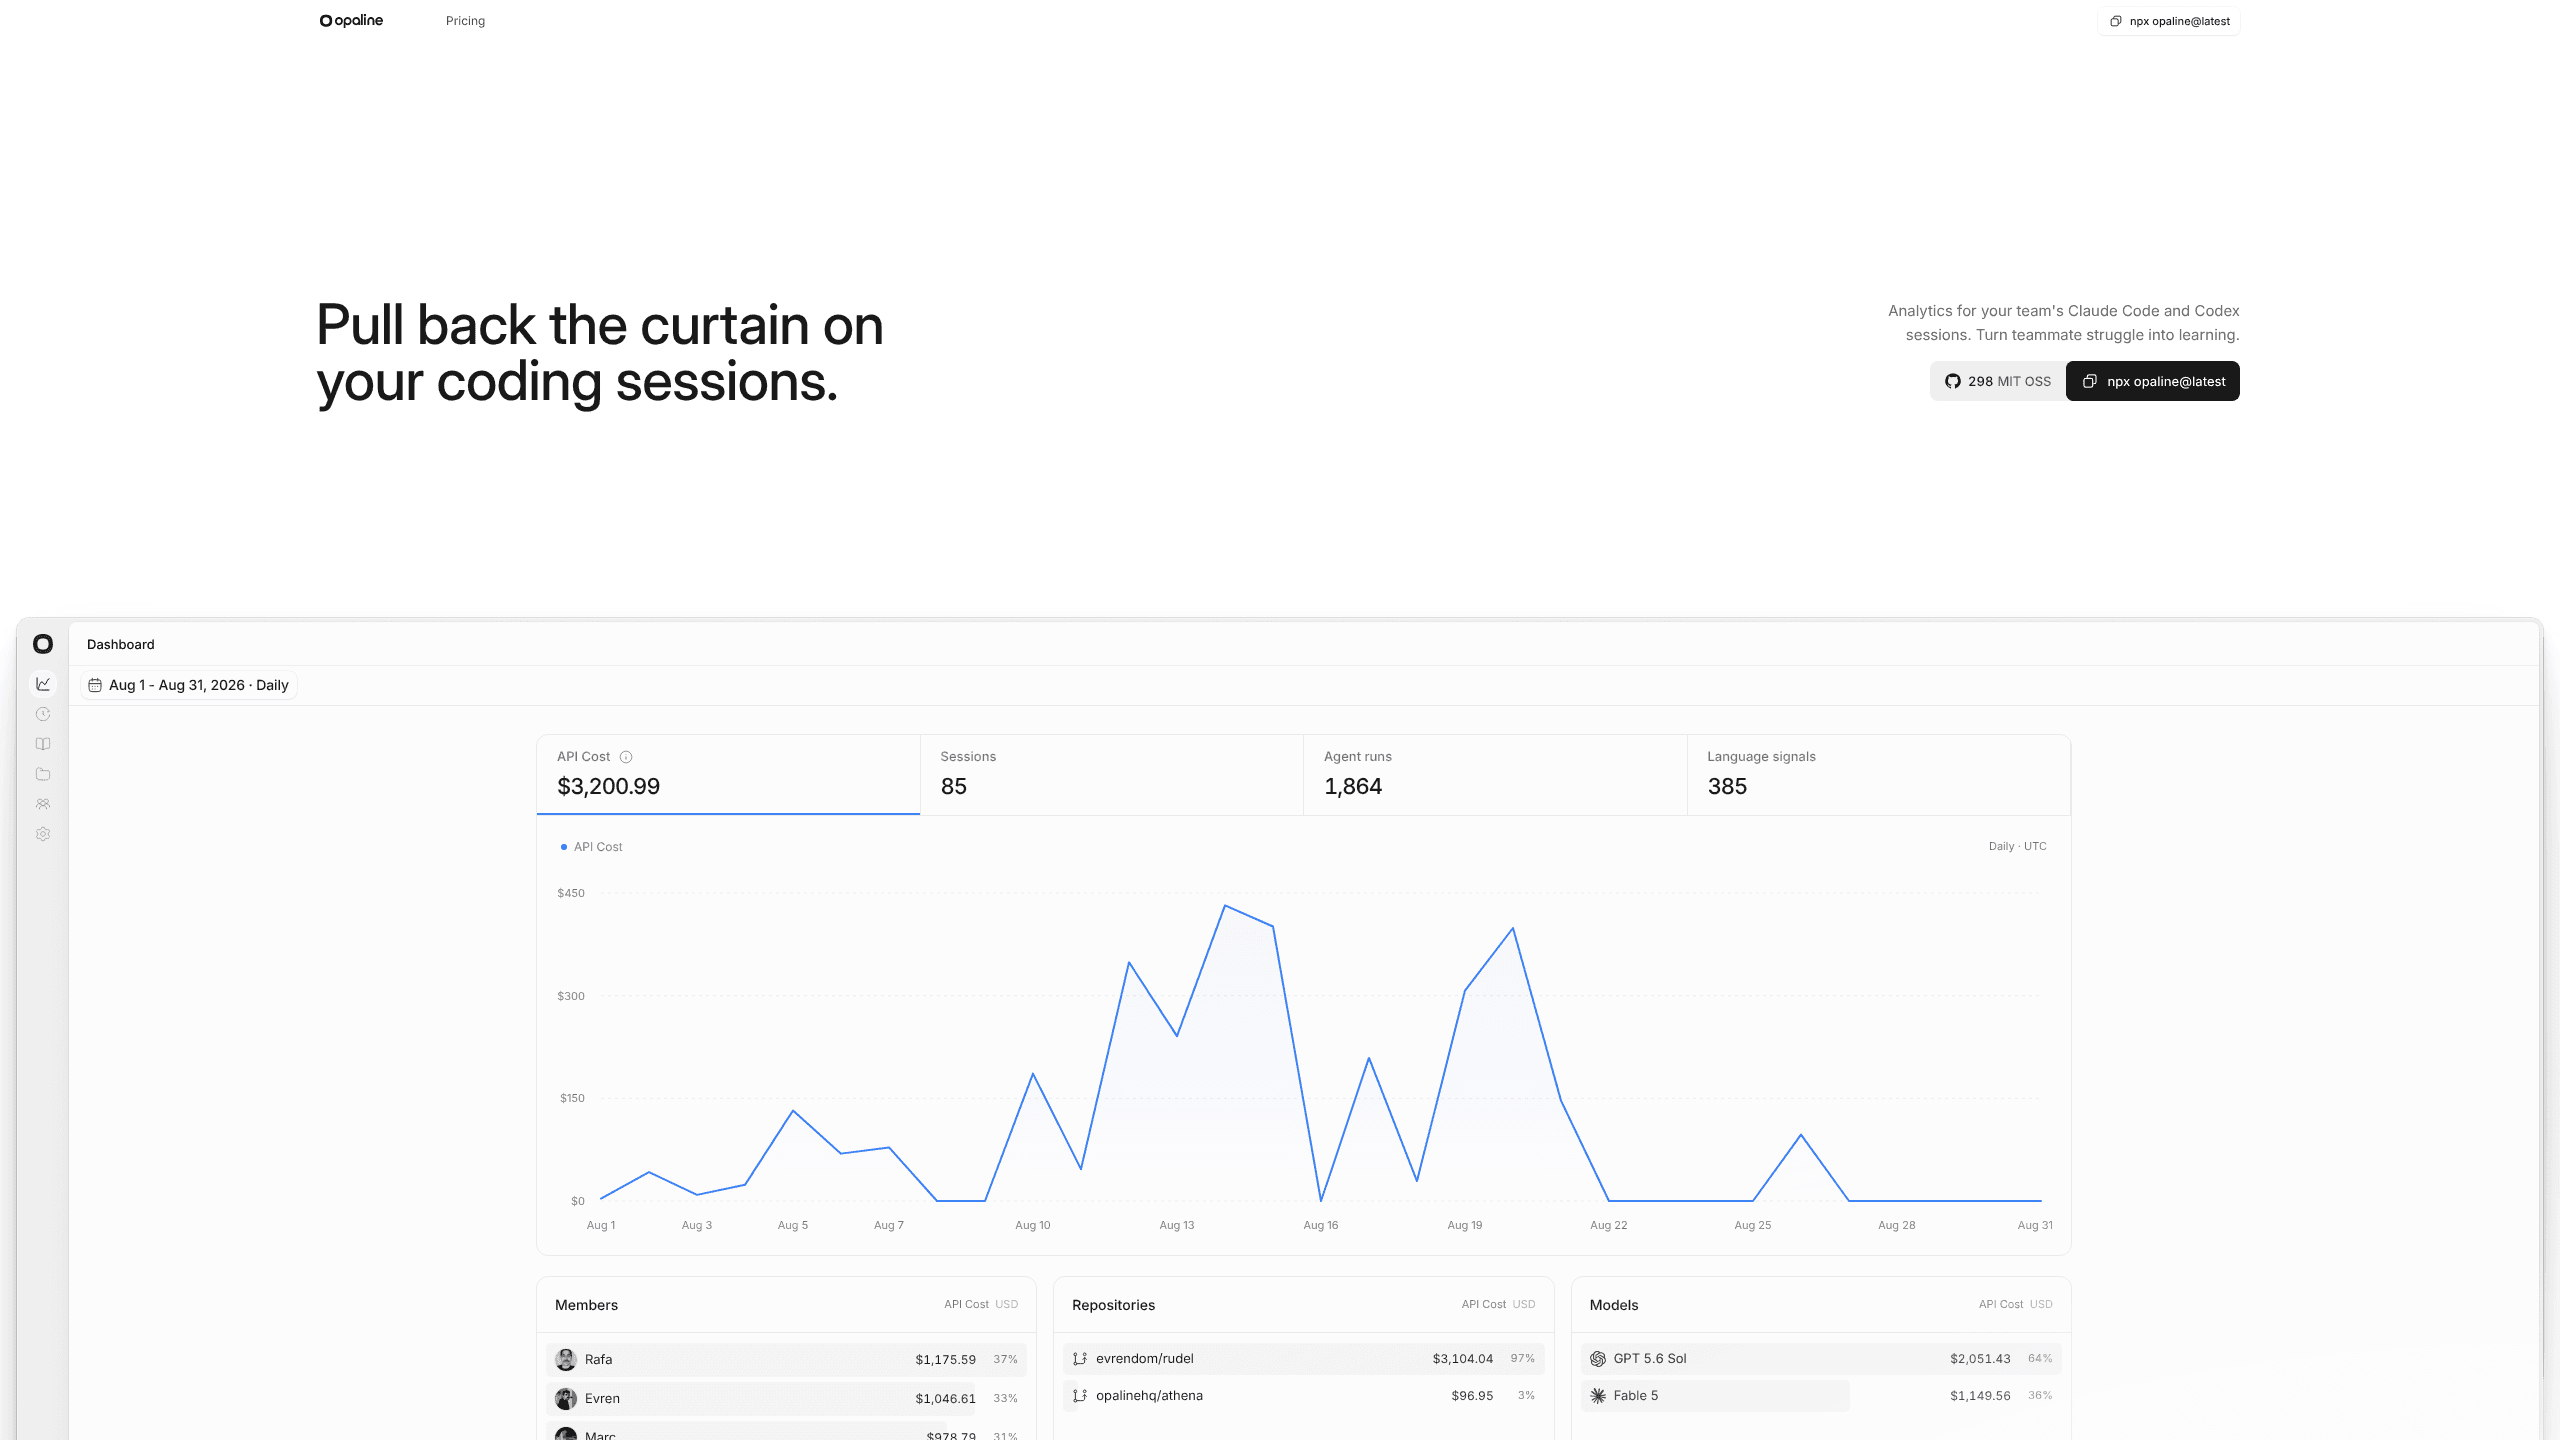
Opaline is a web dashboard and open-source CLI that turns your team's Claude Code and Codex sessions into shared analytics, with adoption and token spend figures plus a view of where agent work went.
About Opaline
What Is Opaline
Opaline is coding agent analytics for teams that run Claude Code and Codex. It collects the transcripts those tools already write on each developer's machine, sends them to a shared workspace, and renders the record as dashboards and per-session timelines. The line on the homepage sums up the intent: pull back the curtain on your coding sessions.
Most teams learn about their agent usage from a bill. Someone notices the Anthropic invoice doubled, or a lead asks why a feature took three days, and nobody can reconstruct what the agent actually did. Opaline answers with the session itself, message by message, including tool calls, command output, and subagent work.
The company sells to engineering organizations rather than individuals, and the pricing shows it: flat workspace fees instead of per-seat charges, with identity, self-hosting, and admin controls reserved for Enterprise. Support covers Claude Code and Codex only, so a team standardized on Cursor, Copilot, or Gemini CLI won't find its usage here.
Getting Started
- Create a workspace at opaline.so.
- Run npx opaline@latest on a machine that has Claude Code or Codex sessions. Node.js 20 or newer is required, and there's no global install.
- Pick repositories in the terminal picker. Sessions are grouped by repository, and Space toggles each one on or off.
- Confirm the selection and sign in through the browser and pick a workspace if your account belongs to more than one.
- Existing sessions upload, and the CLI installs hooks so later sessions sync on their own. New users finish setup in the browser; returning users land on the Sessions page.
Product Information
A quick look at Opaline's pricing, supported platforms, and performance.
Best for
The users, tasks, and scenarios where this tool fits best.
Users
- Engineering managers
- Platform and developer experience teams
- Finance and operations leads
Tasks
- Measuring whether a Claude Code rollout stuck
- Debugging a run that went sideways
- Explaining a spike in API cost
Scenarios
- A 40-person engineering org rolling out Claude Code
- A platform team maintaining shared CLAUDE.md and skill files
- A monthly engineering review
Key features
Org-Level Adoption and Token Spend Analytics
The main dashboard shows how many people use coding agents, how often they run, how many tokens they burn, and what that spend comes to across the organization. You can break the view down by team, repository, or agent. That turns a vague question about ROI into a few numbers you can put in a slide. Token spend tracking at this level shows whether usage is concentrated in a handful of power users or spread across the team.
Message-Level Session Trace Viewer
Open any session and you get the full timeline: prompts, model responses, tool calls, commands, file edits, and subagent activity, in the order they happened. This is the part that answers "what went wrong" rather than "how much did it cost." A failed refactor stops being a mystery once you can read the instruction that sent the agent down the wrong path.
Repository Picker With Automatic Sync
The CLI scans local session directories, groups what it finds by repository, and lets you choose which ones sync. Sessions already uploaded are skipped, so a re-run doesn't duplicate history. Once a repository is on, hooks installed for Claude Code and Codex push new sessions, and running sessions stream transcript lines within seconds, which is what makes Codex session analytics usable while work is still in progress.
Advanced Session Intelligence
Business and Enterprise plans add pattern detection across the workspace. The system looks for recurring blockers, failure modes, and opportunities that show up across many sessions, then surfaces them as findings rather than leaving each developer to rediscover the same wall. This is the difference between a log archive and AI coding observability: one stores events, the other points at what keeps repeating.
Weekly Agent Reports
A digest goes out each week with adoption numbers, performance changes, notable sessions, and team trends. It's developer productivity analytics aimed at the person who has to report upward and doesn't want to build a dashboard from scratch every Friday. Business and Enterprise include it; Free and Basic don't.
Enterprise Deployment and Identity Controls
Enterprise adds SAML and SCIM for single sign-on and automated provisioning, role and policy controls, self-hosted deployment inside your own infrastructure, invoice or purchase order billing, and help migrating existing data. For a regulated company, self-hosting is often the difference between approving a tool and banning it, because transcripts contain source code and command output.
Pros and cons
Pros
- Flat workspace pricing means adding developers doesn't add seats, so the cost stays predictable as a team grows.
- The trace viewer is detailed enough to settle arguments about what an agent did, including tool calls and subagent threads.
- The CLI is open source under MIT, so security teams can read what gets collected before they approve it.
- Live streaming puts a running session in the dashboard within seconds, which helps during an incident rather than a month later.
- Self-hosting, SSO, and SCIM are available on Enterprise, which covers the procurement checklist for larger companies.
Cons
- Only Claude Code and Codex are supported. A team using Cursor, GitHub Copilot, or Gemini CLI gets no coverage for those tools.
- Full transcripts are uploaded, including prompts, responses, and source code. Secret filtering is best effort, so sensitive data can still slip through.
- The free plan stops at 50,000 agent runs per workspace each month and leaves out pattern detection and weekly reports.
- Only the person who uploaded a session and workspace admins can open it, which limits peer review unless you hand out admin roles.
Frequently asked questions
Opaline collects Claude Code and Codex session transcripts from developer machines and turns them into a shared record of agent usage. You get dashboards for adoption and token spend, plus a per-session timeline that shows every prompt, response, and tool call.
Related content
Explore related tools, skills, and articles for Opaline.
Opaline Alternatives

Base Code
Base44 (Wix) · Coding · ProductivityBase Code is a shared cloud development environment from Base44. Teammates describe changes to an existing GitHub codebase in chat, preview them live and send them back as pull requests.

Google EmbeddingGemma 2
Google DeepMind · Writing · Image · CodingGoogle EmbeddingGemma 2 is a 740M-parameter open model that turns text, code, images, audio, and video frames into vectors in one 768-dimension space, running on phones and laptops.

GitGlow
GitGlow · Coding · ProductivityGitGlow is a local-first desktop Git client that lets independent developers review their own code and their AI agents' changes in one place before shipping.