

Orcablue
Orcablue Technologies Pvt Ltd · Coding · Marketing
Orcablue is an embedded analytics platform that lets SaaS teams offer interactive reports and dashboards inside their own product. It pairs a semantic layer with no-code BI.
About Orcablue
What Is Orcablue
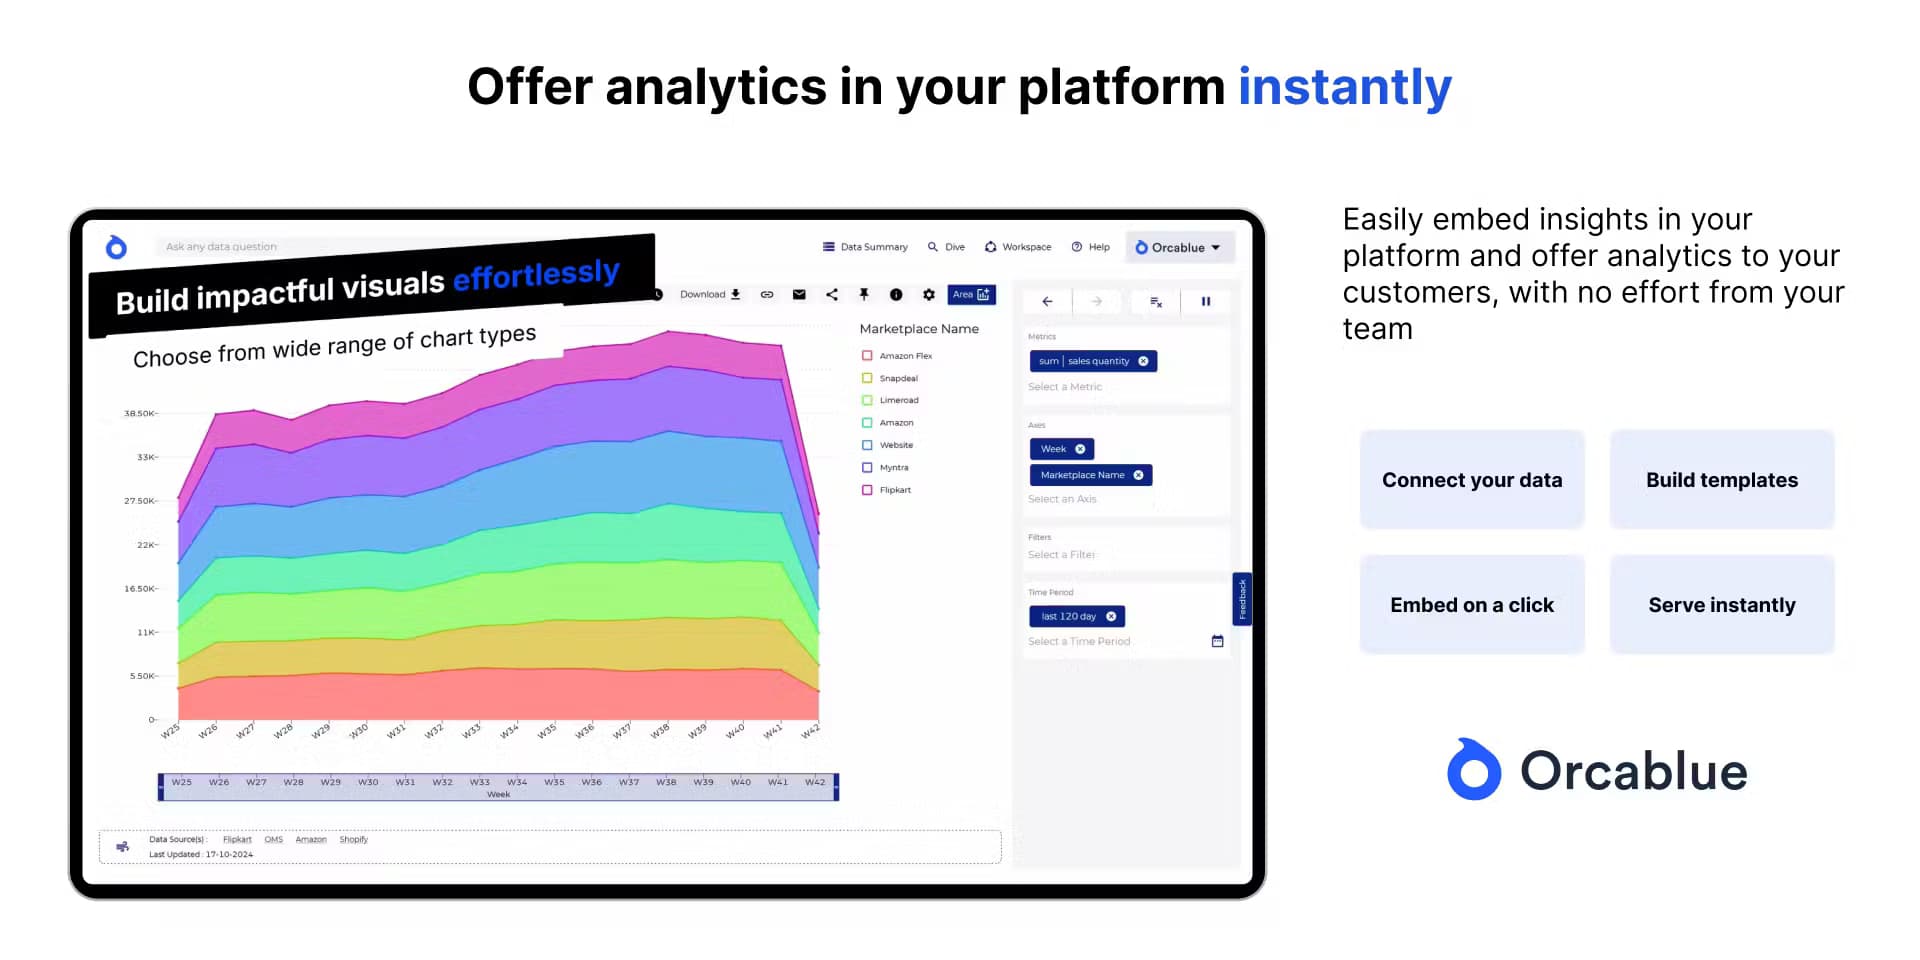
Orcablue is a data analytics platform built for companies that want to hand analytics to their own customers, not just their internal teams. You connect it to a database, shape your metrics and dimensions, then embed the resulting charts and dashboards directly into your product. The idea is simple. Your users see reports inside the app they already pay for, and your engineers stay out of the reporting business.
The company behind it is Orcablue Technologies Pvt Ltd, based in Bengaluru. It positions the product around a unified semantic model, a customizable semantic layer and free-text search over your data. In practice that means a retailer can pull together point-of-sale records, ecommerce channels and marketing spend into one place, then let a regional manager run an analysis without filing a ticket.
The catch is scope. Orcablue is an infrastructure product that lives inside someone else's app, so a solo analyst or a small team with no software product won't get much from it. There is no public self-serve signup or published price list either. You talk to sales, agree on a plan and roll it out to your customers from there.
Getting Started
- Talk to the Orcablue team and map out which customer-facing reports you want to expose first
- Connect your data warehouse or lakehouse, or upload additional files through the file upload module
- Configure datasets, metrics and dimensions in the semantic model so every team reports from the same definitions
- Build charts and dashboards in the visual editor, then embed them into your platform with a single click
- Set row-level and role-based access rules so each customer sees only the data they are allowed to see
Product Information
A quick look at Orcablue's pricing, supported platforms, and performance.
Best for
The users, tasks, and scenarios where this tool fits best.
Users
- SaaS product teams
- Embedded analytics buyers at software companies
- Retail and ecommerce operators
- Business users inside a customer account
Tasks
- Embedding reports into a SaaS product
- Building a branded self-serve portal
- Unifying scattered data sources
- Setting row-level permissions
- Free-text data search
Scenarios
- A SaaS vendor wants to upsell analytics
- A retailer joins channels together
- A business user has a question
- Data access has to stay controlled
- Reporting needs to standardize
Key features
Embedded Dashboards and Reports
Orcablue lets you embed any chart or dashboard into your own product with a single click. These embeddable dashboards get customized to match your platform's look and feel, then rolled out to customers. The point is that analytics becomes a feature of your app, not a separate tool you send users to.
Unified Semantic Model
The semantic model pulls data from different sources into one source of truth, and you build an interconnected model on top of it. When everyone queries the same definitions, teams no longer fight over whose report is correct. Instead of standardizing reports across departments, you only standardize metrics and KPIs.
Customizable Semantic Layer
The semantic layer sits between your raw tables and the visuals, letting you define datasets, metrics and dimensions once. Because every downstream chart reads from that layer, a change to a definition flows through everywhere at once. It is the piece that keeps embedded analytics consistent as the number of reports grows.
Free-Text Data Search
Once your data lives in the semantic layer, users can search for queries and datasets in plain text. A manager who needs a number does not have to know how the warehouse is structured or wait for an analyst to run a query. That shift is what Orcablue means by serving users directly.
Enterprise-Grade Security and Access Control
Integrated single sign-on lets users log in without extra steps, and every request is checked for the user's identity and permissions before it is served. Built-in role-based access plus granular row-level permissions let you control exactly which records each user or group can reach. For embedded analytics, that control is not optional, since one customer must never see another's data.
Branded Self-Serve Portal
Orcablue lets you tailor the offering to match what each customer needs. You can open a fully branded self-serve analytics portal for premium users, or deliver ready-made analytics with minimal effort for everyone else. Both options run off the same underlying model, so supporting a premium tier does not mean maintaining a second reporting stack.
Pros and cons
Pros
- Cuts the build cost of customer-facing analytics: product teams embed dashboards instead of standing up their own reporting layer
- The semantic layer keeps metrics consistent, so reports stop drifting between departments
- Row-level and role-based permissions fit multi-tenant software, where every customer must be walled off
- Free-text search lets nontechnical users query data without learning a BI tool
- One-click embedding suits vendors who want analytics to feel like a native part of their product
Cons
- No public signup or published pricing, so you cannot evaluate it without talking to sales first
- It is built for companies that already have a software product to embed into, which rules out standalone analysts
- Small teams without a data warehouse or lakehouse may find the setup heavier than they need
- The platform is web-only, so there is no native desktop or mobile app for building reports
Frequently asked questions
Orcablue is used to embed interactive reports and dashboards inside another company's software product. SaaS teams connect their data, shape it in a semantic layer and then offer analytics to their own customers without building a reporting stack from scratch.
Related content
Explore related tools, skills, and articles for Orcablue.
Orcablue Alternatives

Base Code
Base44 (Wix) · Coding · ProductivityBase Code is a shared cloud development environment from Base44. Teammates describe changes to an existing GitHub codebase in chat, preview them live and send them back as pull requests.

Google EmbeddingGemma 2
Google DeepMind · Writing · Image · CodingGoogle EmbeddingGemma 2 is a 740M-parameter open model that turns text, code, images, audio, and video frames into vectors in one 768-dimension space, running on phones and laptops.

GitGlow
GitGlow · Coding · ProductivityGitGlow is a local-first desktop Git client that lets independent developers review their own code and their AI agents' changes in one place before shipping.