

Plerdy
Plerdy · Marketing
Plerdy is a web analytics tool that shows where visitors click, scroll and drop off, then combines heatmaps, session recordings and a daily SEO audit in one dashboard.
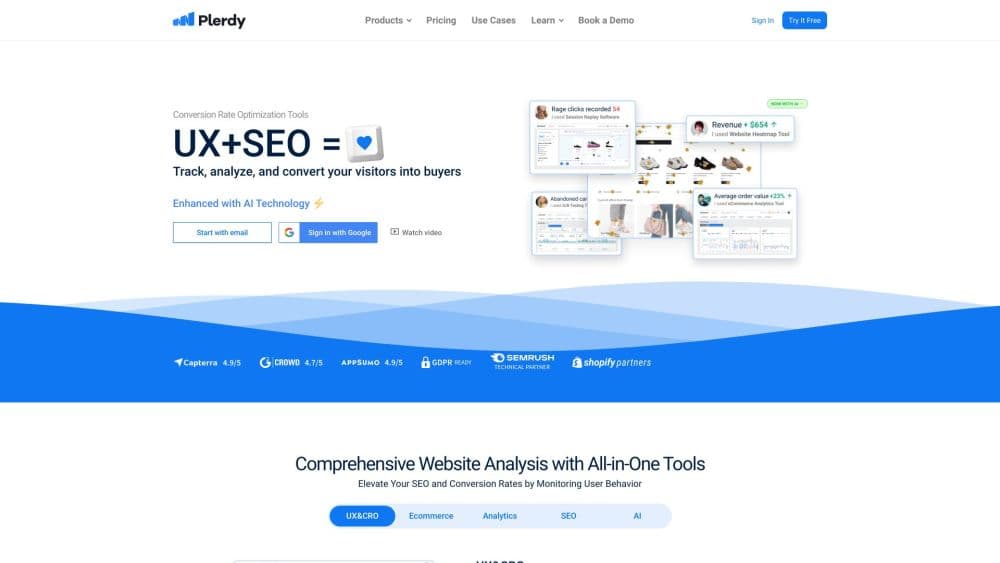
About Plerdy
What Is Plerdy
Plerdy is a conversion rate optimization and SEO analytics platform for websites. It drops a small JavaScript snippet onto your pages, records what visitors actually do, and turns the raw behavior into heatmaps, videos of real sessions, and a scoring report for each URL. The goal is narrow: find the parts of a page that stop people from buying or signing up.
The tool is built for people who already pay for traffic. When ad spend and sales don't line up, the question is usually why visitors leave. Plerdy's answer is visual. A click map shows the button people keep tapping that doesn't work. A scroll map shows the section nobody reaches. A recording shows the exact moment someone hesitated at checkout. A separate SEO checker runs daily audits so you see the technical issue on the same screen.
The limits are worth knowing up front. Plerdy doesn't edit your site, so fixes still go to your developer or CMS. Plans are sold per site, and each package caps page views, video sessions and audit volume. Data lives in the dashboard, not in a warehouse you own. For a small team that wants answers inside one week, that trade is fine. For an enterprise that needs raw event exports into its own BI stack, it won't be enough.
Getting Started
- Create a Plerdy account and start the 14-day trial, which gives you the limits of the Scale package.
- Install the tracking snippet before the closing body tag, or use Google Tag Manager, the Shopify app, or the WordPress plugin. Setup instructions appear after signup.
- Add your domain and confirm the tag is firing. Subdomains and related domains can sit under one account and share the same limits.
- Open the heatmap, session replay or SEO audit for the page you care about, then set filters by device, traffic source or URL.
- Review the weekly report by email, share a read-only link with a teammate, or connect the account to Claude or ChatGPT through the MCP connector.
Product Information
A quick look at Plerdy's pricing, supported platforms, and performance.
Best for
The users, tasks, and scenarios where this tool fits best.
Users
- Small and mid-size online store owners
- Marketing agencies
- SEO specialists
- Solo founders and indie hackers
Tasks
- Finding broken buttons and dead clicks
- Understanding checkout drop-off
- Getting a technical SEO picture without another subscription
- Collecting emails or discount signups
- Running A/B tests on a low budget
Scenarios
- A paid campaign underperforming
- A site redesign about to ship
- A single-page app that other analytics tools miss
Key features
Click, Scroll and Movement Heatmaps
The click heatmap marks every area people click and separates real clicks from taps on non-interactive elements. As a website heatmap tool, it also ships scroll and movement views in the same report. The scroll map shows how far down a page visitors reach, which usually explains why a call to action placed near the bottom never gets seen. A movement map adds a third layer for hesitation, since the cursor hovering around shipping details or a form field is a different signal from a click. Heatmaps are dynamic, meaning they work on menus, pop-ups, sliders and other elements that change position.
Session Recordings and Rage Click Detection
Plerdy records full browser sessions as replayable video, filtered by device, traffic source or specific user actions. You can jump straight to sessions that contain rage clicks, JavaScript errors or exits on a given page. Watching one checkout attempt is often faster than reading a funnel report, and the clip can be shared with a developer as a bug report.
Daily SEO Audit and Page Scoring
Every page with incoming traffic gets a health score and a breakdown of technical issues: missing titles, thin content, broken links, mobile rendering problems and slow loading. The audit also compares mobile and desktop versions, which matters because Google indexes the mobile rendering first. A Chrome extension runs a one-off analysis of any URL, including competitors, and reports come back as a PDF.
Pop-Ups, Forms and Lead Capture
The pop-up tool covers exit intent, timed and scroll-based triggers, with templates and a visual editor. Form and survey widgets connect to email marketing tools, and Plerdy records which fields cause people to abandon a form. Display limits are counted daily per plan, so a busy site may need a top-up.
A/B Testing Across Pages and Elements
The split test tool changes text, images, buttons or whole page variants and reports a winner with statistical confidence. Unlike some CRO suites, Plerdy doesn't cap the number of experiments per plan, which matters for teams that prefer many small tests over one long one.
AI Connectors Through MCP
On every paid plan, Plerdy exposes its reports to Claude, ChatGPT, Cursor and other MCP clients through a read-only connector. You ask questions in plain language, such as which pages lost the most revenue last week or why conversions dropped, and the assistant pulls the numbers from your account. Each plan includes a daily request quota, from 100 requests on Startup to 5,000 on Enterprise 3, and no visitor personal data leaves the platform.
Traffic Source to UX Analysis
The dashboard now maps campaigns and referral channels to user experience problems. You can sort by landing page URL and see which traffic sources produce rage clicks, which page a source sends people to, and where a channel's budget ends up going to waste.
Pros and cons
Pros
- One account covers heatmaps, recordings, SEO audit, pop-ups, A/B tests and error monitoring, which removes three or four separate subscriptions for a small team.
- The tracking script loads fast and the vendor runs no sampling, so reports on low-traffic pages stay usable.
- Subdomains, cross-domain sites and a single-page app setup all run under one dashboard, with no per-seat pricing.
- The MCP connector lets a non-analyst query real site data from Claude or ChatGPT without writing SQL.
- Support replies within 12 to 24 hours on business days, and the pricing page lists every limit per package, so the cost is predictable.
Cons
- Pricing is per site. An agency with ten client properties pays ten times, and the entry plan's page view ceiling arrives quickly on a site with steady traffic.
- The free plan after the trial has tight limits and only one month of adjusted usage, so it works as a demo more than a working tool.
- Plerdy reports problems but doesn't fix them. Every change still goes through your CMS or development team.
- There's no native mobile app, so checking reports on a phone means using the browser version.
Frequently asked questions
Plerdy records how visitors move through your site and shows the result as heatmaps, session videos and a per-page SEO score. It's built to answer why traffic doesn't turn into sales, not to replace a general analytics tool like Google Analytics 4. It connects to GA4 rather than competing with it.
Related content
Explore related tools, skills, and articles for Plerdy.
Plerdy Alternatives

ngram 2.0
ngram · Video · Marketingngram 2.0 is an AI video generator for teams. It turns a prompt, a screen recording, or a product URL into a narrated explainer, product demo, or AI avatar video, and every scene stays editable.

shippedit.me
Krawlup · Marketing · Businessshippedit.me now redirects to Krawlup, a web platform that audits SEO, AEO and page speed every week, then hands the fixes to AI coding agents over MCP.

MePersona
MePersona, Inc. · Writing · Productivity · MarketingMePersona is an AI unified inbox for creators. It learns your voice, drafts replies to fan messages from 12 platforms, and sends only what you approve.