

PredictLeads Technographics Dataset
PredictLeads · Coding · Business
The PredictLeads Technographics Dataset is a B2B data product that identifies which technologies companies actually run, then attaches pricing information so you can estimate what each account spends. It covers more than 46,000 technologies across roughly 65 million companies, drawing signals from website script tags, DNS records, and job postings rather than survey data. Teams use it as a technology detection API and as a building block for B2B tech data pipelines. If your team does sales prospecting or builds tech-stack intelligence into a product, this is the raw material behind those workflows.
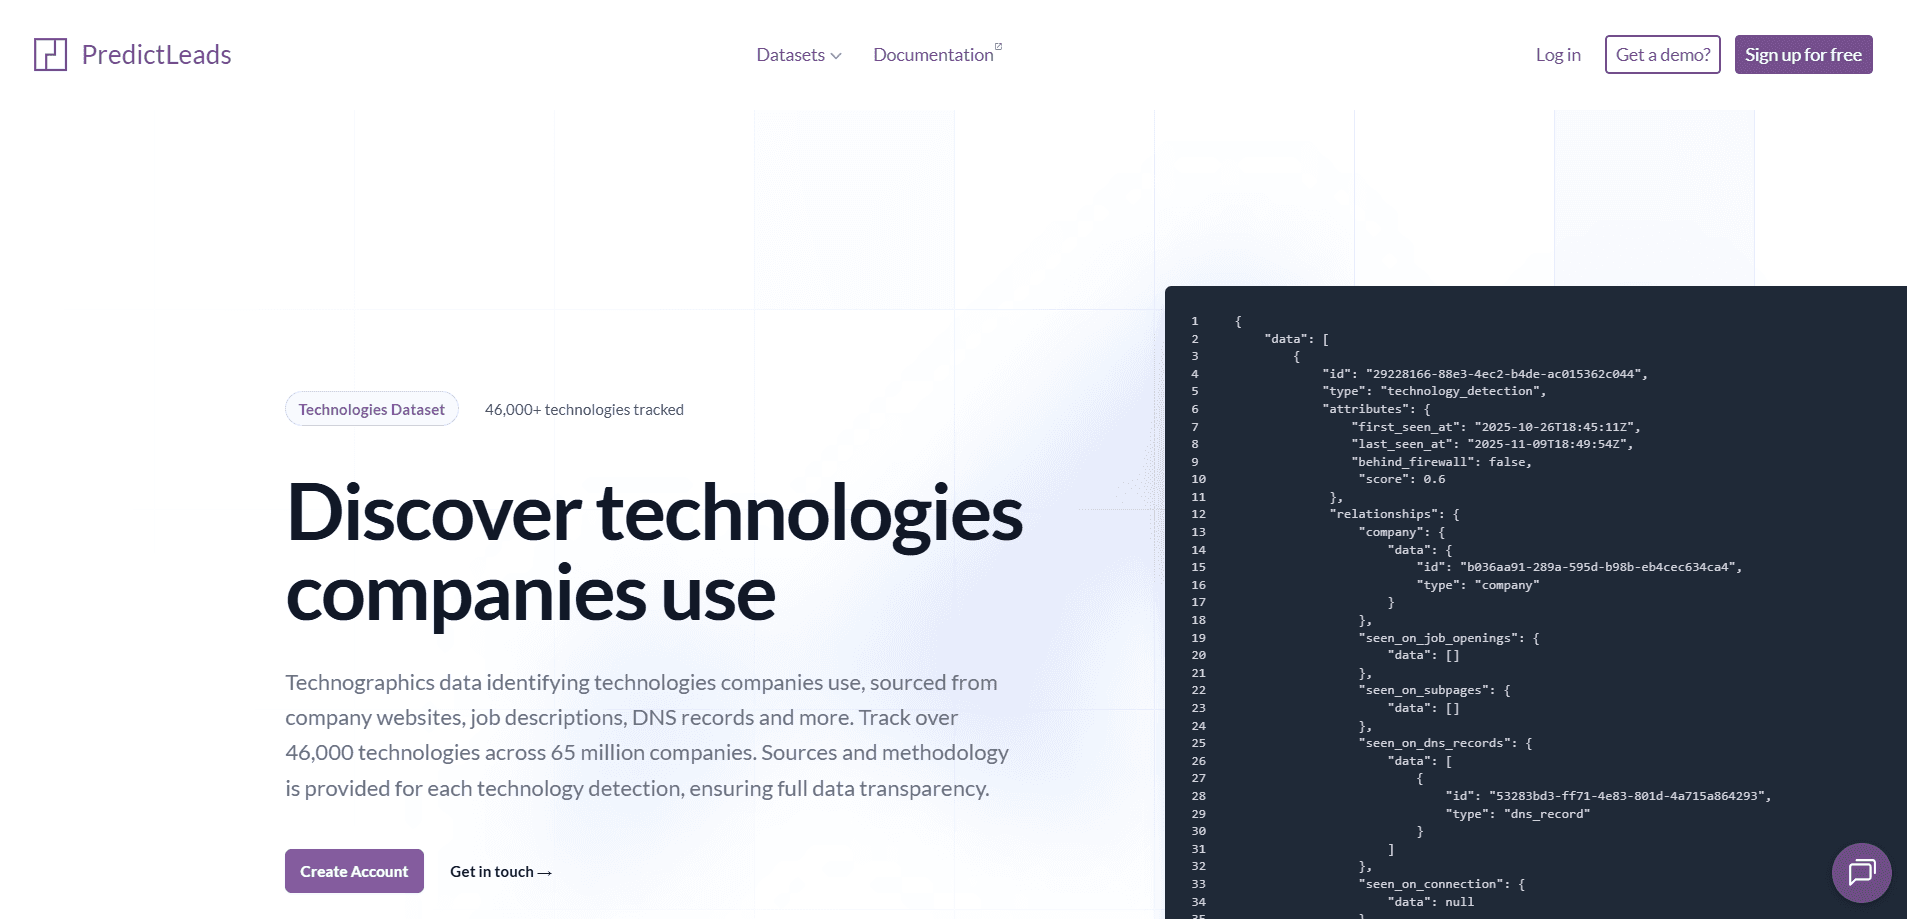
About PredictLeads Technographics Dataset
What Is PredictLeads Technographics Dataset
PredictLeads built this dataset for teams that need to know a company's tech stack without asking. Instead of relying on self-reported data, it watches three independent signals: what scripts load on a site, which DNS records point where, and which tools show up in job descriptions. Those signals get matched against a catalog of over 46,000 technologies and tied to specific companies.
The core problem it solves is prospecting accuracy. A SaaS vendor selling a CRM add-on wants to find companies already running Salesforce or HubSpot. A data team wants to screen thousands of accounts at once instead of researching them by hand. The dataset returns structured detections with timestamps, source counts, and location data, so results are auditable rather than guesswork.
The biggest limitation is access, not coverage. There's no free tier or self-serve sign-up. Everything is credit-based, so you pay per API request. So what happens when you hit the monthly cap? Requests return a 402 error and no extra credits get consumed. Discovery endpoints that return multiple companies bill per company instead. In practice, that means this is a paid, developer-oriented product, not a dashboard you poke at on a whim.
Getting Started
- Request access through the PredictLeads site and pick a plan that matches your monthly credit needs.
- Grab your API key from the account dashboard and confirm your credit limit.
- Pick a delivery method: the REST API, webhooks for real-time signals, flat files for bulk work, or MCP for AI agents.
- Call the Technology Detections endpoint with filters like company domain, category, or location.
- Handle the paginated response and watch your credit counter, since each request and each discovered company costs credits.
Product Information
A quick look at PredictLeads Technographics Dataset's pricing, supported platforms, and performance.
Best for
The users, tasks, and scenarios where this tool fits best.
Users
- Sales development and demand-gen teams
- Product and RevOps analysts
- Data engineers at AI startups
Tasks
- Finding companies that use a competitor's product, so outreach starts with a relevant hook rather than a cold pitch.
- Estimating technology spend by account, using the pricing enrichment that ships alongside each detection.
- Enriching a CRM with tech-stack fields, so a lead record shows which tools a company already runs.
- Tracking technology changes over time, since detections carry first-seen and last-seen timestamps.
Scenarios
- Building a lookalike list before a product launch
- Cleaning up a bloated prospect list
- Feeding an internal AI agent company-intelligence context through MCP, so it can reason about which tools a target already owns.
- Screening inbound leads for tech fit before routing them to a rep.
Key features
Multi-Source Technology Detection
The dataset doesn't trust a single signal. It combines website script tags, DNS records, and job postings, then scores how confident each detection is. A tool seen in 39 different sources on a company's site carries far more weight than one buried in a single job ad. Cross-checking matters. It's what separates this from tools that only scrape what a homepage happens to load.
Pricing Enrichment for Spend Estimates
Each technology detection can carry pricing context, which lets you estimate how much a company likely spends on its stack. This feature turns a simple who-uses-what list into a budget signal you can sort by. If you're prioritizing accounts by deal size, a company running a fleet of paid enterprise tools looks very different from one still tinkering on free tiers.
Coverage at Company Scale
The catalog spans over 46,000 technologies mapped to roughly 65 million companies worldwide. Company technology data gets thin fast outside the US. This breadth matters when your market is niche or international, since a smaller dataset would leave you guessing about regions outside the US.
Flexible Delivery: API, Webhooks, and MCP
You can pull data through the REST API, subscribe to webhooks for real-time updates, grab flat files for bulk analysis, or connect AI agents through MCP. Flat files suit one-off market studies. Webhooks suit monitoring a shortlist of accounts you follow. The MCP option is newer and aimed at teams wiring this into agent workflows. Not every dataset offers that.
Credit-Based Request Model
Pricing runs on credits. One API request usually equals one credit, and a single request can return up to 1,000 records. Filters and pagination behave differently. Filters are free. Each page is its own request. Each page is its own credit. So push the limit up rather than loop through results.
Timestamps and Source Counts
Every detection carries first-seen and last-seen timestamps plus a source count. That's what makes the data usable for trend work rather than just snapshots. You can tell a long-standing Salesforce install from a tool that appeared last month, which is a real difference when timing outreach.
Pros and cons
Pros
- Combines three independent detection sources, so fewer false positives than single-signal scrapers.
- Pricing enrichment adds spend estimates, which most technographic datasets skip.
- Broad coverage of 46,000+ technologies and 65 million companies, including non-US markets.
- Multiple delivery options (API, webhooks, flat files, MCP) fit different engineering setups.
- Filters don't cost credits, so refining a query is free.
Cons
- No free plan or self-serve trial, so you can't test it without talking to sales.
- Credit costs stack up fast: pagination charges per page, and discovery endpoints bill per returned company.
- Unused credits don't roll over, which hurts teams with uneven monthly usage.
- It's a developer product. Without API skills or a connected tool, the data sits out of reach.
Frequently asked questions
It's a structured record of which technologies companies use, matched to specific companies. Company technology data here means the technology name, the company, timestamps, source counts, and where the signal came from, plus pricing context for spend estimates.
Related content
Explore related tools, skills, and articles for PredictLeads Technographics Dataset.
PredictLeads Technographics Dataset Alternatives

Base Code
Base44 (Wix) · Coding · ProductivityBase Code is a shared cloud development environment from Base44. Teammates describe changes to an existing GitHub codebase in chat, preview them live and send them back as pull requests.

Google EmbeddingGemma 2
Google DeepMind · Writing · Image · CodingGoogle EmbeddingGemma 2 is a 740M-parameter open model that turns text, code, images, audio, and video frames into vectors in one 768-dimension space, running on phones and laptops.

GitGlow
GitGlow · Coding · ProductivityGitGlow is a local-first desktop Git client that lets independent developers review their own code and their AI agents' changes in one place before shipping.