

PredictOPs
PredictOPs · Coding · Marketing
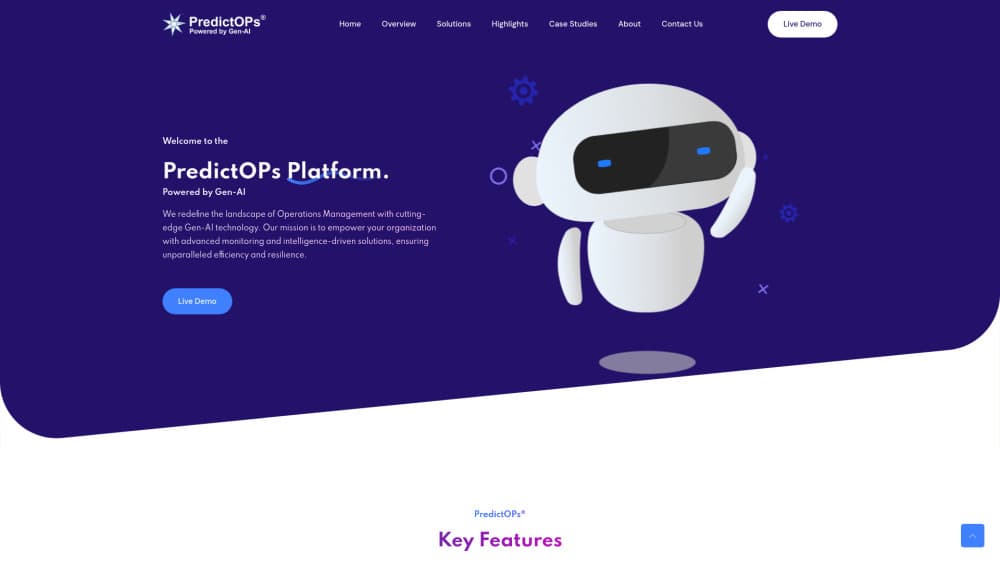
PredictOPs is a Gen-AI operations platform for IT and DevOps teams. It monitors logs, correlates alerts, detects anomalies, and predicts failure rates across microservices and infrastructure.
About PredictOPs
What Is PredictOPs
PredictOPs is an AIOps platform built around one promise: catch operational trouble before users report it. It collects log data from the systems you already run, groups related alerts into a single incident, and uses machine learning to flag behaviour that drifts away from a learned baseline. The company describes the product as Gen-AIOps, meaning a generative AI layer sits on top of the usual monitoring and correlation work. That mix of forecasting and day-to-day monitoring is what the vendor calls predictive operations.
The product is aimed at teams running microservice architectures. Instead of watching a dozen dashboards, you get a combined view of service health, alert groups, and failure trends. PredictOPs says the platform fits cloud and on-premises environments and connects to third-party monitoring tools, so it works alongside collectors you already pay for. The vendor also says its algorithms are written in Python and covered by a pending patent.
The limits matter as much as the feature list. There's no public price list and no self-serve sign-up, so a sales conversation comes first. Detection quality depends on how much history your logs carry and how clean they are. And the performance claims on the website come from the vendor, with no independent benchmark published. Treat a pilot on your own data as the real test.
Getting Started
- Request a demo through the PredictOPs website. Expect a scoping call about your stack, log volume, and whether you run in the cloud, on-premises, or both.
- Connect your log sources and monitoring tools. The platform is designed to sit on top of existing collectors rather than replace them.
- Let the system learn a baseline, then set alert rules and severity levels. Early tuning decides whether the anomaly detection helps or just adds noise.
- Work incidents from the dashboard. Correlated alerts, microservice health, and failure trends sit in the same place.
- Review the trends weekly. Infrastructure log behaviour and failure rate analysis are most useful when someone acts on the patterns they expose.
Product Information
A quick look at PredictOPs's pricing, supported platforms, and performance.
Best for
The users, tasks, and scenarios where this tool fits best.
Users
- DevOps and SRE teams running microservices
- IT operations managers at mid-sized companies
- System administrators in hybrid environments
Tasks
- Cutting alert noise after an incident spike
- Finding the service behind a latency regression
- Predicting which components are likely to fail
- Preparing a reliability review
Scenarios
- A microservice rollout that changes traffic patterns
- A team that already collects logs but has no analytics layer
- An on-premises or hybrid environment
Key features
Log Data Monitoring
PredictOPs ingests log data and presents it with real-time visibility rather than a raw search box. The point is to surface patterns and outliers as they appear, not hours later during a postmortem. Teams that already ship logs to a store can keep that pipeline and add IT operations analytics on top.
Alert Correlation
This is the feature most likely to affect daily work. The platform groups alerts that share a cause, reducing the stream of separate notifications that hit an on-call engineer. The vendor frames the result as incident clarity: fewer pages, and a faster read on the root cause. Correlation rules still need tuning, especially in a noisy environment.
Microservice Management
The platform provides an end-to-end view of a microservice architecture, with health and performance data for individual services. It also covers auto-scaling behaviour, so you can see whether scaling kept pace with demand. For teams running dozens of services, that beats stitching together screenshots from separate tools.
Anomaly Detection
Anomaly detection learns what normal looks like for your system and flags deviations. The vendor says the algorithms adapt as behaviour changes, which is the difference between a static threshold and a model that follows seasonal traffic. It works best with a few weeks of clean history, and it needs human review before anyone treats a flag as a confirmed fault.
Infrastructure Log Behaviour Analysis
This feature looks at how infrastructure logs behave over time, not just whether a single line matches an error pattern. The practical use is capacity and performance work: spotting a disk that fills faster each week or a node that restarts more often than its peers. PredictOPs presents the result as a basis for performance tuning.
Failure Rate Analysis
Failure rate analysis tracks how often components fail and whether the trend is rising. That gives operations teams a way to prioritise maintenance instead of reacting to the loudest alert. The vendor positions it as proactive work, and the value depends on acting on the trend before the outage happens.
Pros and cons
Pros
- Combines log monitoring, alert correlation, anomaly detection, and failure analysis in one AIOps platform, which reduces the number of tools an operations team has to manage.
- The Gen-AI layer is aimed at explanation and pattern finding, not just charting, so it can shorten the path from an alert to a likely cause.
- Supports cloud and on-premises deployments, a real advantage for regulated or hybrid environments.
- Microservice monitoring covers scaling behaviour, which helps during traffic spikes and rollout periods.
- The vendor offers a demo before purchase, so you can test the analysis against your own logs.
Cons
- No public pricing and no free tier. You can't evaluate cost or run a self-serve trial without talking to sales.
- Detection quality depends on log volume and history. A small or messy dataset will produce weaker baselines and more false flags.
- No independent benchmarks are published, so performance claims rest on the vendor's own material.
- The feature set is broad but the workflow is built for IT operations. Teams outside DevOps will find little here for analytics or business forecasting.
Frequently asked questions
PredictOPs is used to monitor IT operations with AI. It collects logs, correlates related alerts, detects anomalies, and analyzes failure rates so teams can fix issues before they turn into outages. The main users are DevOps, SRE, and system administration teams.
Related content
Explore related tools, skills, and articles for PredictOPs.
PredictOPs Alternatives

Base Code
Base44 (Wix) · Coding · ProductivityBase Code is a shared cloud development environment from Base44. Teammates describe changes to an existing GitHub codebase in chat, preview them live and send them back as pull requests.

Google EmbeddingGemma 2
Google DeepMind · Writing · Image · CodingGoogle EmbeddingGemma 2 is a 740M-parameter open model that turns text, code, images, audio, and video frames into vectors in one 768-dimension space, running on phones and laptops.

GitGlow
GitGlow · Coding · ProductivityGitGlow is a local-first desktop Git client that lets independent developers review their own code and their AI agents' changes in one place before shipping.