

Pulse for Elasticsearch and OpenSearch
NeverBlink · Coding · Other
Pulse for Elasticsearch and OpenSearch is an AI platform from NeverBlink that watches your clusters, flags slow queries and wasted spend, and hands you fixes to apply.
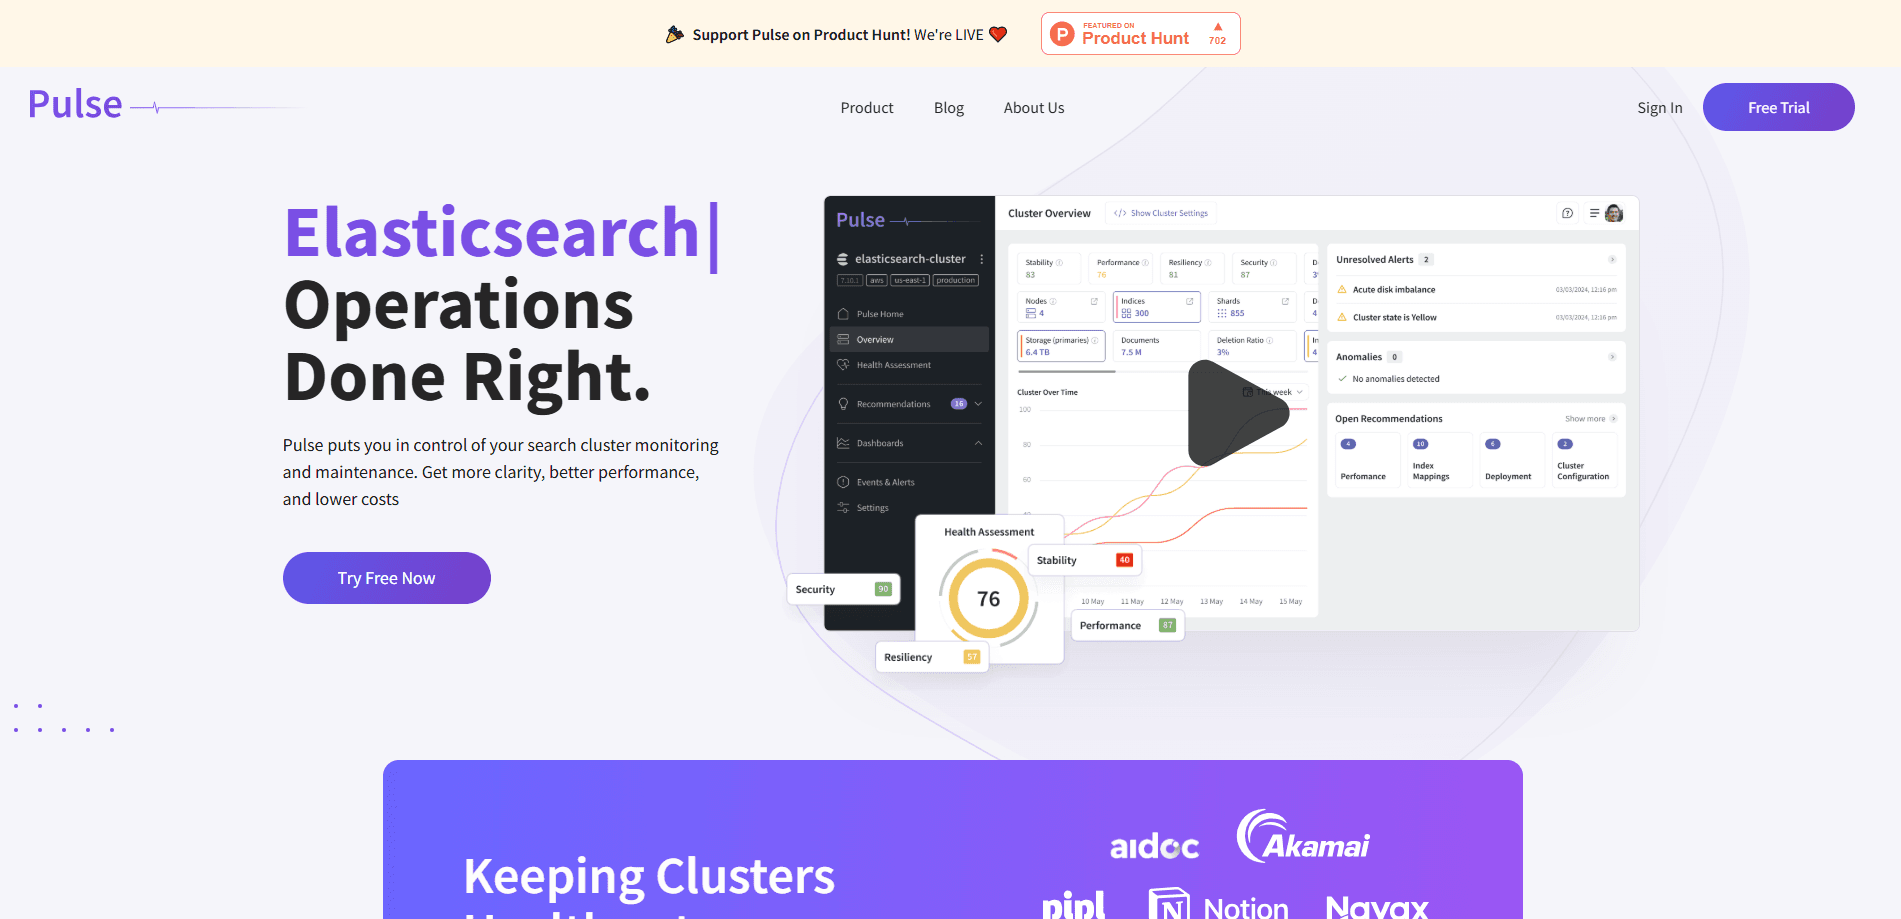
About Pulse for Elasticsearch and OpenSearch
What Is Pulse for Elasticsearch and OpenSearch
Pulse is a monitoring and optimization tool for teams running Elasticsearch or OpenSearch. Instead of leaving you to read dashboards and guess, it inspects your clusters around the clock and tells you what's slow, what's wasteful, and what's about to break. Every recommendation comes with the reasoning behind it, so your engineers stay in control of what gets applied.
The problem it goes after is the quiet tax of running search clusters at scale: slow queries, runaway cloud bills, and 2 a.m. pages. That expertise is scarce and hard to keep in-house, and it gets harder as AI agents ship queries and schemas at machine speed. Pulse plugs into what you already run rather than replacing it, and it works alongside tools like Grafana and Datadog by adding database-specific root-cause analysis those tools don't see.
The limits are worth knowing up front. Pulse reads metrics and metadata only, so it can't inspect the contents of your documents. It recommends changes rather than applying them on its own, which means someone on your team still has to act on them. And full support today centers on Elasticsearch and OpenSearch, with ClickHouse and PostgreSQL still in private beta.
Getting Started
- Connect your clusters through a lightweight collector that runs in your environment, with nothing installed on the database servers themselves
- Let the platform read metrics, logs, queries and configuration to build a picture of each cluster's health
- Review the prioritized recommendations for indexes, projections and query rewrites, each with its reasoning
- Decide what to apply and when, then track the results on the dashboard
Product Information
A quick look at Pulse for Elasticsearch and OpenSearch's pricing, supported platforms, and performance.
Best for
The users, tasks, and scenarios where this tool fits best.
Users
- Platform engineers
- SRE teams
- Data engineers
- Engineering managers
- AI agent builders
Tasks
- Cut cluster costs
- Debug slow queries
- Assess cluster health
- Prevent incidents
- Review index mappings
- Feed agents
Scenarios
- A platform team running dozens of clusters
- A team facing a surprise cloud bill
- A search outage at an awkward hour
- An AI workflow that queries live data
- A small startup with one cluster
Key features
Continuous Cluster Health Assessment
Pulse scores the health of every cluster it watches and keeps that score updated as conditions change. You see what's stable and what needs attention side by side, without opening a dozen consoles. It's the difference between hunting for problems and being told where they are.
Query Analytics That Pinpoint What's Expensive
The platform traces query patterns across each cluster and fingerprints them, then surfaces the slow, expensive and redundant queries behind your latency and cost. You get per-query latency, call counts and resource usage, plus concrete recommendations on indexes, projections and rewrites. That turns a vague "it feels slow" into a specific fix.
Automated Root-Cause Analysis
When an alert fires, Pulse goes past the raw signal and explains what likely caused it, along with the actions to take. It's built to complement monitoring tools like Grafana and Datadog rather than replace them, adding database-specific root-cause analysis those tools don't provide. The point is to cut the time between a warning and a fix.
Cost Optimizer
Pulse flags the choices quietly inflating your cloud bill, such as over-provisioned nodes and indexes that cost more than they earn. The cost optimizer currently works for cloud deployments, so teams on self-managed infrastructure won't get every cost signal. Even a quarterly review can pay for itself when a cluster is over-built.
Single Pane of Glass
Every database you run lands in one view, across clusters, environments and clouds, and you can group them the way your team thinks about them. Each cluster's health score and active alerts sit right next to it. For anyone juggling multiple consoles, that consolidation is the feature that saves the most time.
API and MCP Server for Builders
A full REST API and an MCP server let you wire Pulse into your workflows, CI pipelines and tools. You can connect it to Claude Code, Codex and Cursor so your AI agents reason about the data platform using real insights instead of guesses. It also creates tickets from recommendations in systems like GitHub and Jira.
Pros and cons
Pros
- Reads metrics and metadata only, so your actual data never leaves your environment
- Recommendations come with reasoning, and your team decides what to apply
- Query analytics name the specific queries, indexes and mappings behind latency and cost
- Single view covers every cluster across clouds, environments and teams
- REST API and MCP server let AI coding agents work from real signals
- SOC 2 Type II certified, with a collector that installs nothing on the database servers
Cons
- It recommends rather than applies changes, so you still need someone to act on them
- Full support centers on Elasticsearch and OpenSearch, with ClickHouse and PostgreSQL still in private beta
- The cost optimizer only covers cloud deployments, so self-hosted setups miss those signals
- Pricing is charged per cluster per month, which adds up for teams running many small clusters
Frequently asked questions
It's an AI-powered monitoring and optimization platform for Elasticsearch and OpenSearch clusters, built by NeverBlink. It checks cluster health, analyzes queries, finds wasted cost, and hands you prioritized fixes with the reasoning behind each one.
Related content
Explore related tools, skills, and articles for Pulse for Elasticsearch and OpenSearch.
Pulse for Elasticsearch and OpenSearch Alternatives

Base Code
Base44 (Wix) · Coding · ProductivityBase Code is a shared cloud development environment from Base44. Teammates describe changes to an existing GitHub codebase in chat, preview them live and send them back as pull requests.

Google EmbeddingGemma 2
Google DeepMind · Writing · Image · CodingGoogle EmbeddingGemma 2 is a 740M-parameter open model that turns text, code, images, audio, and video frames into vectors in one 768-dimension space, running on phones and laptops.

GitGlow
GitGlow · Coding · ProductivityGitGlow is a local-first desktop Git client that lets independent developers review their own code and their AI agents' changes in one place before shipping.