

Spot Insights
CloudPilot AI · Marketing
Spot Insights is a free CloudPilot AI tool for real-time and historical spot instance pricing plus interruption rates across AWS, Azure, GCP, and Alibaba Cloud. Compare rates fast.
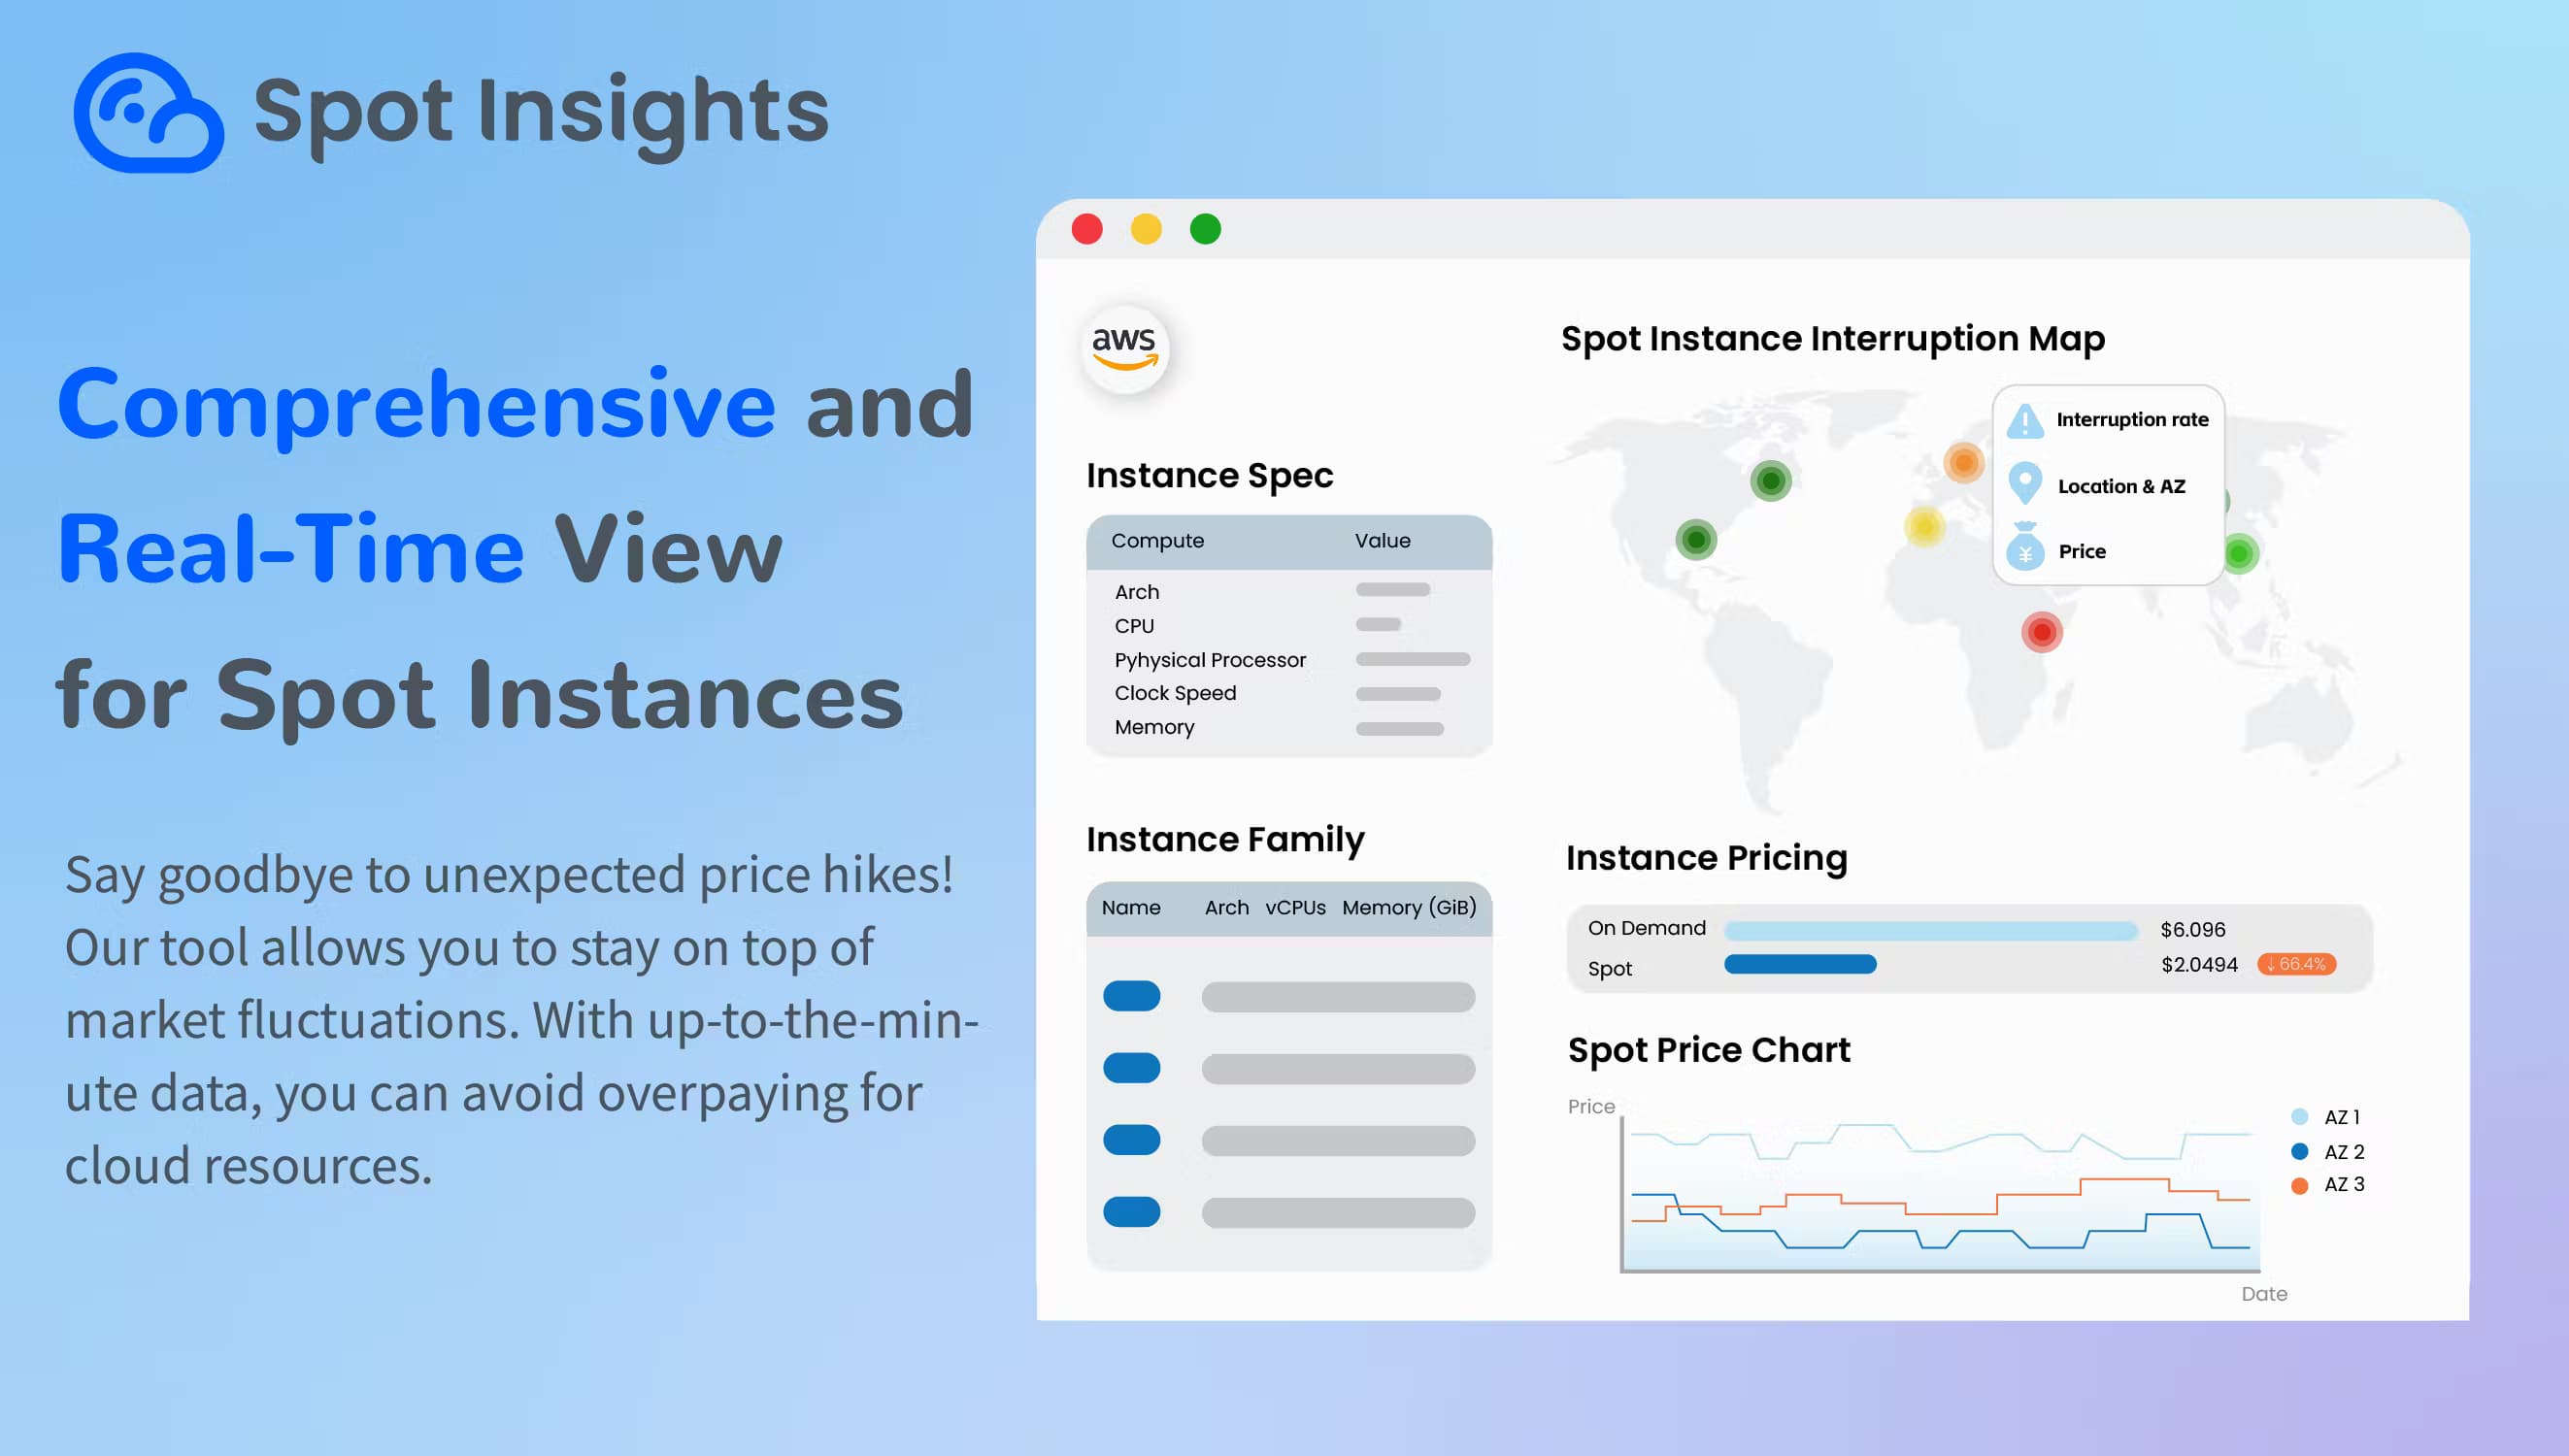
About Spot Insights
What Is Spot Insights
Spot Insights is a public data tool from CloudPilot AI. It gathers spot instance prices and interruption rates from several cloud providers and lays them out in one place, so you don't have to open four separate consoles to compare.
Spot instances rent spare cloud capacity at a steep discount, but the price moves and the provider can take the machine back. That makes two numbers matter more than anything else: how much you pay per hour, and how often that instance type gets reclaimed in a given zone. Spot Insights puts both in front of you.
The tool is a reference site, not a subscription product. Sellers of cloud optimization services often bundle this data behind a sales call, so a free, openly accessible view is unusual. The catch is that you still decide what to do with the numbers. Spot Insights doesn't launch instances or move your workloads for you.
Getting Started
- Open spot.cloudpilot.ai in any browser. There's no signup and no install.
- Pick a cloud provider, then narrow down by region or availability zone.
- Filter by instance family, vCPU count, or memory size to match your workload.
- Compare current price against the on-demand rate and check the interruption trend before you commit.
Product Information
A quick look at Spot Insights's pricing, supported platforms, and performance.
Best for
The users, tasks, and scenarios where this tool fits best.
Users
- Cloud and platform engineers
- DevOps teams running Kubernetes
- FinOps analysts
Tasks
- Picking an instance type for a batch job
- Planning a spot migration
- Choosing an availability zone
Scenarios
- Early cost research before a cloud migration
- Ongoing cluster tuning
- Cross-provider comparisons
Key features
Real-Time Spot Pricing
The dashboard shows the current hourly rate for spot instances, updated as the market moves. You can compare that figure against the on-demand price in the same view, so the discount is obvious at a glance. For teams watching a tight budget, that live number is the one that matters.
Interruption Rate Data
Spot capacity can vanish, and the chance of that happening varies widely by instance type and zone. Spot Insights surfaces interruption rates so you can steer toward the calmer pools. It's the difference between a node that runs for days and one that drops out mid-task.
Historical Price Trends
Current prices tell you today's story. Spot price history charts show how a rate has drifted over time, which matters when you're planning capacity for a quarter rather than an afternoon. Seeing the swings upfront helps you avoid betting on a discount that's already fading.
Availability Zone Breakdown
Spot economics differ zone by zone inside a single region. The tool breaks prices and interruption rates down to the availability zone level, so you can spread workloads across the cheapest, most stable zones. That granularity is where a lot of the savings hide.
Multi-Cloud Coverage
Spot Insights covers AWS, Azure, Google Cloud, and Alibaba Cloud in one interface. You can pull up Azure spot VM pricing next to a GCP spot VM listing without logging into each console. That side-by-side view is handy when a team runs across more than one cloud or is weighing a move.
No Signup or Cost
The tool loads in the browser with no login and no fee. That lowers the barrier for a quick check during a design meeting or a late-night debugging session. You get the data without a sales call attached.
Pros and cons
Pros
- Free and open in a browser, with no account or install required
- Combines pricing and interruption rates, so you weigh cost against eviction risk and fit cloud cost optimization into one view
- Covers AWS, Azure, GCP, and Alibaba Cloud, which cuts time on multi-cloud comparisons
- Drills down to availability zone level, where real spot savings often sit
- Historical charts help you spot price drift before it hits your budget
Cons
- It's a reference tool only, so it won't launch instances or migrate workloads for you
- Real-time rates can shift within minutes, so a snapshot you save today may be stale tomorrow
- API availability isn't documented, so teams wanting programmatic access have to check directly
- Some providers' data can lag behind the console, so verify before a critical deployment
Frequently asked questions
It's a free reference tool for checking spot instance prices and interruption rates across clouds. You use it to compare hourly rates, weigh risk by zone, and plan where to run interruptible workloads. It also feeds cloud cost optimization work, since cheaper capacity and eviction risk sit in the same view. It doesn't manage infrastructure, so think of it as research before a decision.
Related content
Explore related tools, skills, and articles for Spot Insights.
Spot Insights Alternatives

ngram 2.0
ngram · Video · Marketingngram 2.0 is an AI video generator for teams. It turns a prompt, a screen recording, or a product URL into a narrated explainer, product demo, or AI avatar video, and every scene stays editable.

shippedit.me
Krawlup · Marketing · Businessshippedit.me now redirects to Krawlup, a web platform that audits SEO, AEO and page speed every week, then hands the fixes to AI coding agents over MCP.

MePersona
MePersona, Inc. · Writing · Productivity · MarketingMePersona is an AI unified inbox for creators. It learns your voice, drafts replies to fan messages from 12 platforms, and sends only what you approve.