

StatStream–Energy Intelligence
STATOCEAN TECHNOLOGIES LLP · Coding
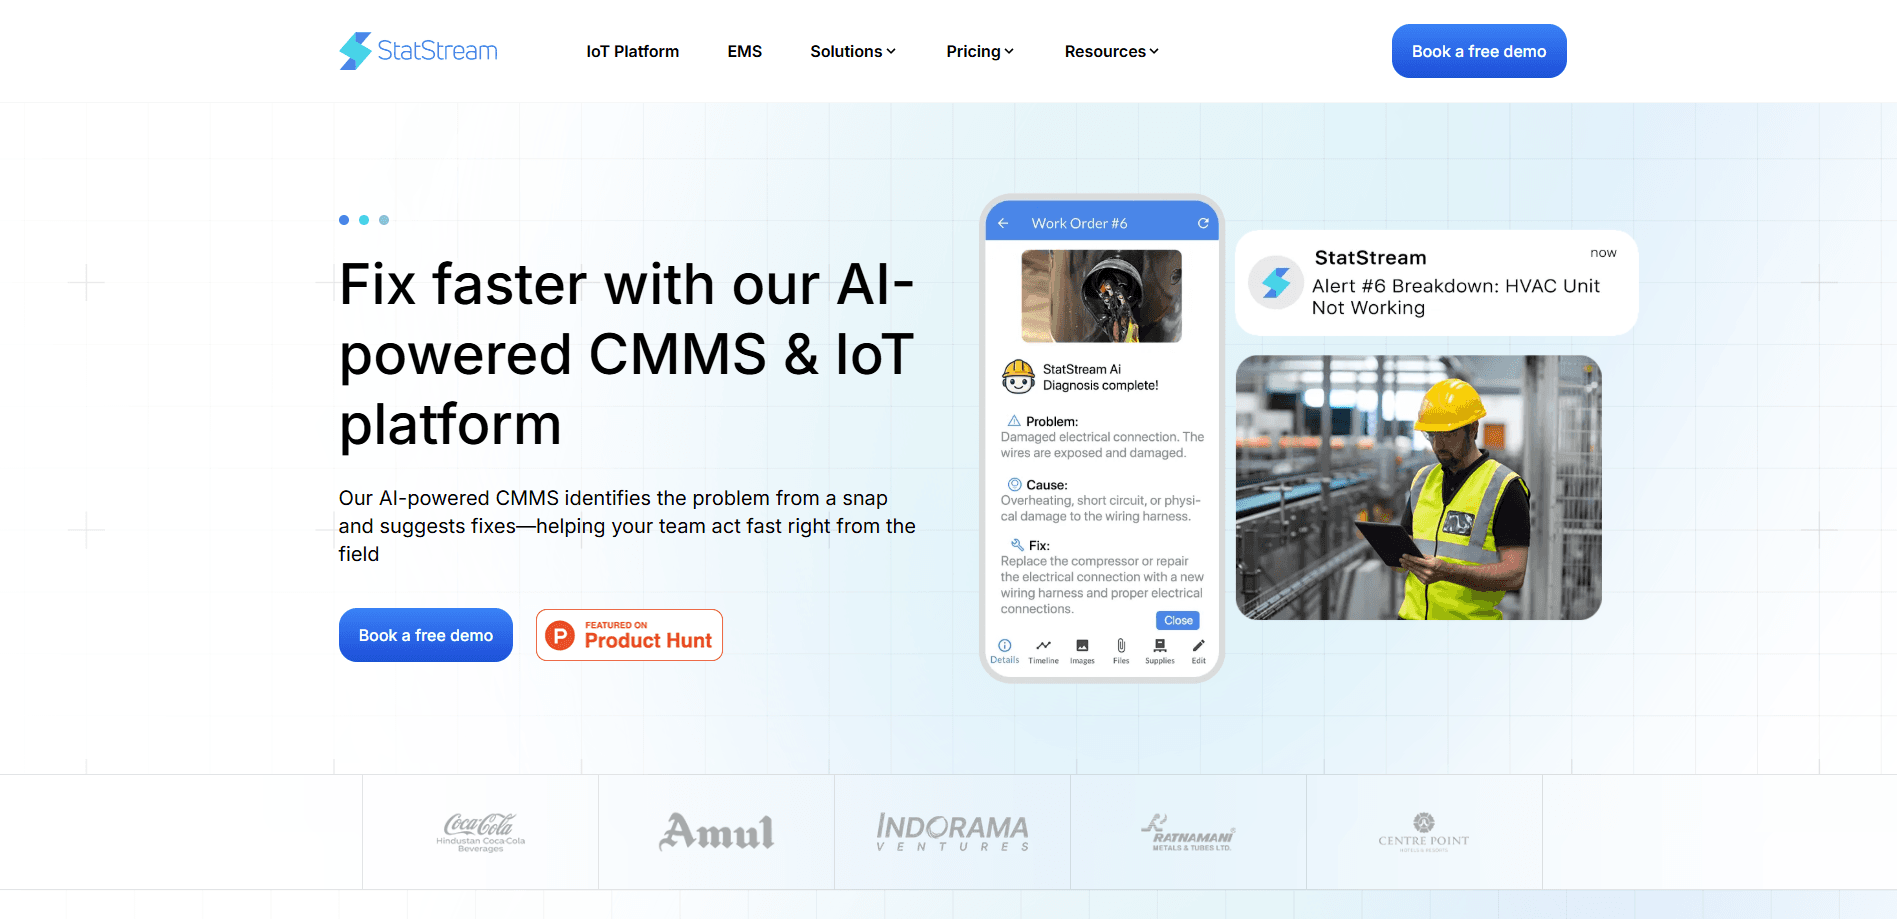
StatStream is an industrial energy intelligence platform that turns live data from meters, PLCs, and machines into savings, alerts, and maintenance work across every plant.
About StatStream–Energy Intelligence
What Is StatStream
StatStream is a cloud platform for factories and energy-intensive operations. It connects to the meters, PLCs, and building systems you already run and turns that raw signal into live dashboards, demand alerts, AI recommendations, and maintenance work orders. The pitch is simple: one screen for energy, assets, and upkeep instead of five disconnected tools. Buyers searching for industrial energy monitoring usually end up comparing an energy management system against a standalone PLC platform; StatStream bundles both.
The platform targets plants that generate a lot of energy data but can't see what's driving demand, penalties, or downtime. According to StatStream, most sites see live data within 24 hours, and a free WhatsApp bill analysis shows where savings might sit before you commit.
The main limits are scope and setup. StatStream isn't a generic AI chatbot and it won't build your hardware. Energy and machine monitoring depend on an IoT gateway or a PLC that sends data over MQTT or HTTP, so you need the right equipment in place. Asset and maintenance management runs without any hardware, but live alerts and AI insights need that data feed first.
Getting Started
- Send a recent electricity bill on WhatsApp or book a demo, and StatStream runs a free tariff comparison and savings estimate.
- Register your assets, or link meters and PLCs through the StatStream IoT Gateway or your own MQTT/HTTP gateway.
- Watch live dashboards by plant, line, and shift, usually live within 24 hours.
- Set threshold, spike, and power quality alerts that route to email, WhatsApp, Slack, or a webhook.
- Act on ranked AI recommendations, then raise and close work orders from the same screen.
Product Information
A quick look at StatStream–Energy Intelligence's pricing, supported platforms, and performance.
Best for
The users, tasks, and scenarios where this tool fits best.
Users
- Plant and energy managers
- Maintenance teams
- OEM manufacturers and system integrators
- Facility and ESG leads
Tasks
- Cutting peak demand charges
- Catching equipment faults early
- Running monthly energy audits
- Tracking asset health
- Managing maintenance requests
Scenarios
- A plant running several meters and PLCs across multiple sites
- A factory facing monthly demand penalties
- A maintenance backlog with no system of record
- Rolling out monitoring under a partner brand
Key features
Energy Intelligence Monitoring
StatStream turns meter and PLC readings into live load curves with active and reactive power overlaid. Managers drill down by plant, line, and shift, then check power factor and maximum demand against contract limits. The point is to see where consumption spikes and why, instead of waiting for the monthly bill. It works as a factory energy dashboard that updates every second, not once a month.
Peak Demand and Penalty Control
The platform watches for demand peaks, low power factor, and contract demand breaches. Pre-event alerts fire before the charge lands, and time-of-use tariff analysis shows which loads to move. This matters most for plants that pay penalties for spikes they never saw coming.
Cloud SCADA and Alerting
Cloud SCADA replaces on-premise supervisory systems with a browser-based view of your plant. Threshold, spike, and power quality alerts route to email, WhatsApp, Slack, or a webhook. You also get abnormal pattern detection that flags issues the moment they start rather than after a line goes down.
AI Anomaly Detection and Recommendations
AI reviews your telemetry shift by shift and flags what looks off. Recommendations come ranked by urgency, so the team sees what to fix first instead of a wall of raw data. An example from the product: a shift compressor running longer than needed, with a scheduling fix that cuts consumption.
Maintenance and Work Order Management
Every machine gets one registry with health scores and service history. Work orders move from request to done, and recurring plans generate the work automatically. Operators can raise a request by scanning a QR code on a machine, which removes the usual paper trail.
PLC and Meter Data Acquisition
StatStream connects meters, PLCs, and building systems over Modbus, OPC UA, MQTT, and REST APIs. You can use the StatStream IoT Gateway or bring your own gateway. There is no rip-and-replace, so the equipment already in your plant stays where it is.
Carbon and Compliance Reporting
Daily, weekly, and monthly reports generate and email automatically, including CO2e tracking and consumption summaries. Reports are built for compliance handoffs, so reporting stops being a manual month-end scramble. Data stays encrypted in transit and isolated per customer, with role-based access and audit logs.
Pros and cons
Pros
- Works with existing meters, PLCs, and BMS over Modbus, OPC UA, MQTT, and REST APIs, so there is no rip-and-replace.
- Combines energy monitoring, cloud SCADA, AI insights, and maintenance in one platform rather than separate tools.
- AI recommendations come ranked by urgency, which saves the team from sorting through raw telemetry.
- Reports, CO2e tracking, and DISCOM-ready formats generate automatically, cutting manual reporting work.
Cons
- Live energy and machine data need an IoT gateway or a PLC that sends data over MQTT or HTTP, so sites without that hardware can't use those features yet.
- Pricing is usage-based with no published rate card, so you can't estimate cost without booking a demo and requesting a quote.
- The mobile apps are view-first: diagram creation and editing stay on the web app, so you can't build diagrams on a phone.
Frequently asked questions
It collects live data from your meters, PLCs, and building systems and turns it into energy dashboards, demand alerts, AI recommendations, and maintenance work orders. Think of it as one operations screen for what your plant is using and what needs fixing.
Related content
Explore related tools, skills, and articles for StatStream–Energy Intelligence.
StatStream–Energy Intelligence Alternatives

Base Code
Base44 (Wix) · Coding · ProductivityBase Code is a shared cloud development environment from Base44. Teammates describe changes to an existing GitHub codebase in chat, preview them live and send them back as pull requests.

Google EmbeddingGemma 2
Google DeepMind · Writing · Image · CodingGoogle EmbeddingGemma 2 is a 740M-parameter open model that turns text, code, images, audio, and video frames into vectors in one 768-dimension space, running on phones and laptops.

GitGlow
GitGlow · Coding · ProductivityGitGlow is a local-first desktop Git client that lets independent developers review their own code and their AI agents' changes in one place before shipping.