

Syft Analytics
Syft Analytics (a Xero company) · Business
Syft Analytics is financial reporting software that turns Xero, QuickBooks, and Sage data into live reports, KPI dashboards, and forecasts, with Syft Assist AI explaining the numbers.
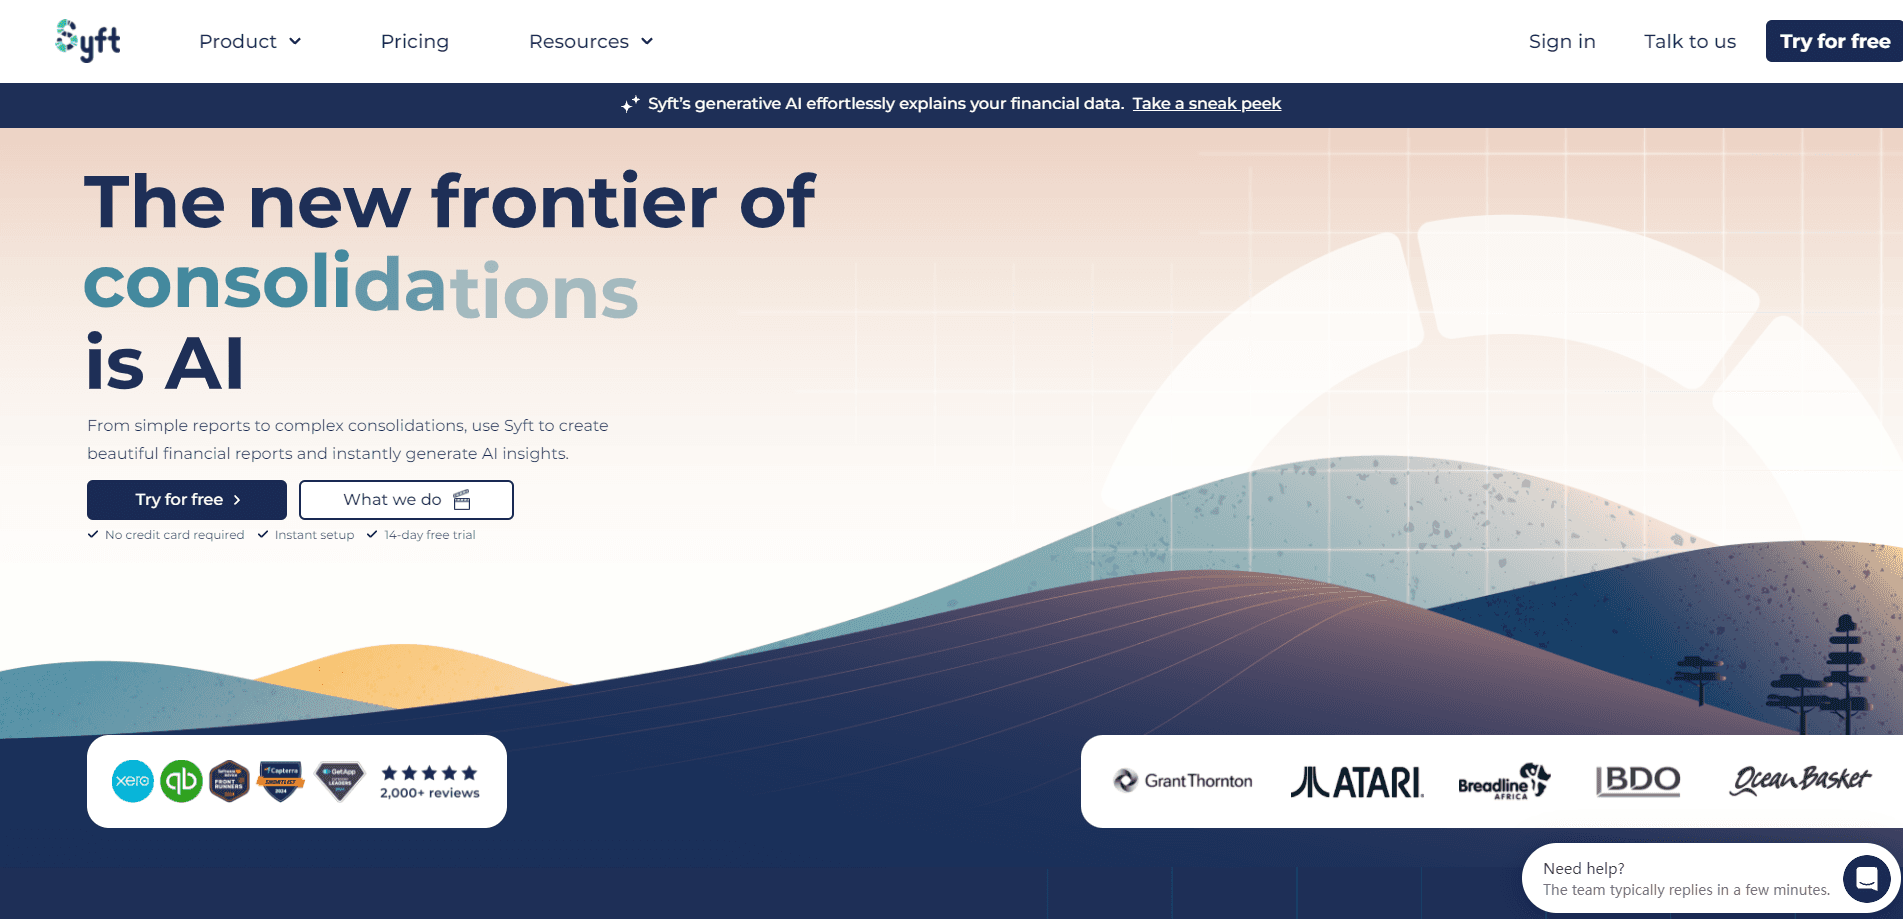
About Syft Analytics
What Is Syft Analytics
Syft Analytics is a cloud reporting platform built for accountants, bookkeepers, and finance teams at small and mid-sized companies. It sits on top of the ledger you already keep and rebuilds the trial balance into management accounts, dashboards, and forecasts. The company started in Cape Town in 2016 and has been part of Xero since 2024.
The problem it solves is a familiar one. Every month, someone exports a trial balance, pastes it into a spreadsheet template, and spends two days formatting a pack that's out of date the moment it's printed. Syft keeps the connection live, so the profit and loss, balance sheet, and cash flow move when the ledger moves. Reports go out as links clients can click through instead of PDF attachments that nobody opens.
The limits matter too. Syft isn't a general purpose BI tool, and layouts follow accounting templates rather than a blank canvas. It also assumes the bookkeeping is clean. A messy chart of accounts will still produce a beautiful mess. Pricing counts entities, so groups with many companies pay more as they add them.
Getting Started
- Create an account and start the 14-day trial, no card needed.
- Connect Xero, QuickBooks Online, or Sage, or upload a trial balance as a CSV or Excel file.
- Map the chart of accounts to Syft's reporting categories. This takes the longest on the first client and gets quicker after that.
- Choose a report template, add commentary, then share a live view or export to PDF, Excel, or Google Sheets.
Product Information
A quick look at Syft Analytics's pricing, supported platforms, and performance.
Best for
The users, tasks, and scenarios where this tool fits best.
Users
- Accounting and bookkeeping firms
- Finance leads at small companies
- Fractional CFOs and consultants
- Group finance managers
Tasks
- Producing monthly management accounts
- Consolidating several entities
- Building a 12-month forecast
- Explaining variances to clients
- Tracking the numbers that matter weekly
Scenarios
- Month-end at a small practice
- Board pack for a startup
- Multi-currency group reporting
Key features
Live Reports Straight From the Ledger
Syft connects to Xero, QuickBooks Online, Sage, and a handful of other sources, then builds standard accounting reports from the trial balance. Reports refresh as the ledger changes, so a client can open a link on the fifth of the month and see current figures. Custom report layouts and formulas are available, and the output keeps a consistent look across clients.
Consolidations Across Entities and Currencies
This is the feature that pulls larger groups in. You can add unlimited entities, apply intercompany eliminations, account for acquisitions and disposals mid-year, and include fractional ownership. Reports support more than 170 currencies, with exchange rates applied at the group level. It replaces a spreadsheet that only one person understands.
Integrated Financial Forecasting
The forecast model links the profit and loss, balance sheet, and cash flow, so a change in revenue assumptions flows through to working capital and cash. You can build scenarios and compare budget against actuals month by month. The output is a set of statements rather than a single revenue chart.
Syft Assist AI
Syft Assist AI reads the report on screen and writes a narration of what changed and why the lines moved. You can also ask it a question out loud and get an answer tied to that report, which helps when a client calls and you need a quick explanation. It drafts the story; it doesn't audit the numbers. Every AI financial analysis still needs a human check before it goes to a client.
Benchmarking and KPI Dashboards
Dashboards track the metrics a business actually manages: gross margin, staff cost as a share of revenue, debtor days, and whatever else the client asks about. Benchmarking compares performance against similar businesses, which gives an accountant something concrete to discuss beyond the numbers themselves. Targets and budget lines can sit alongside the actuals.
Live Views, Exports, and Spreadsheet Link
Reports can be shared as secure live views, which stay interactive and update with the data. Exports cover PDF, Excel, and Google Sheets for the people who insist on a file. The separate Spreadsheet Link add-on connects Excel to Syft data, so a model can pull reported figures without a manual copy and paste.
Pros and cons
Pros
- Reports update from the ledger, so month-end becomes a review rather than a rebuild.
- Consolidations handle eliminations, fractional ownership, and 170+ currencies without a custom spreadsheet.
- Syft Assist AI turns a finished report into readable commentary in seconds, which is the slowest part of client reporting.
- Live views cut the email back and forth, since clients open a link instead of requesting a revised PDF.
- The template library keeps output consistent across a client base of any size.
Cons
- Setup is the real cost. Account mapping takes time on the first client, and a poor chart of accounts turns that into hours.
- Report customization stops at the template. Anyone who needs a free-form layout will want Power BI or Tableau instead.
- Per-entity pricing adds up for groups, and the entry plan leaves out features that make consolidation worthwhile.
- AI output is a first draft. Commentary can misread a one-off item, so someone has to read it before it reaches a client.
Frequently asked questions
It builds financial reports, dashboards, and forecasts from accounting data. Accountants use it for monthly management accounts, groups use it for consolidations, and finance teams use it to track KPIs and compare budget against actuals.
Related content
Explore related tools, skills, and articles for Syft Analytics.
Syft Analytics Alternatives

Knocket
Knocket (Tencent RTC team) · Productivity · Business · ChatbotKnocket is a free live chat and contact page tool that lets visitors message you from your website, app, or a shareable link, with every reply handled from Telegram or one inbox.

shippedit.me
Krawlup · Marketing · Businessshippedit.me now redirects to Krawlup, a web platform that audits SEO, AEO and page speed every week, then hands the fixes to AI coding agents over MCP.

Ayven
Alknoma · Productivity · BusinessAyven is an AI control centre by Alknoma that turns a plain-language goal into a dated plan, hands the work to your people and AI agents, and asks for your approval only when the call is yours.