

Telemetry Harbor
Harbor Scale · Coding
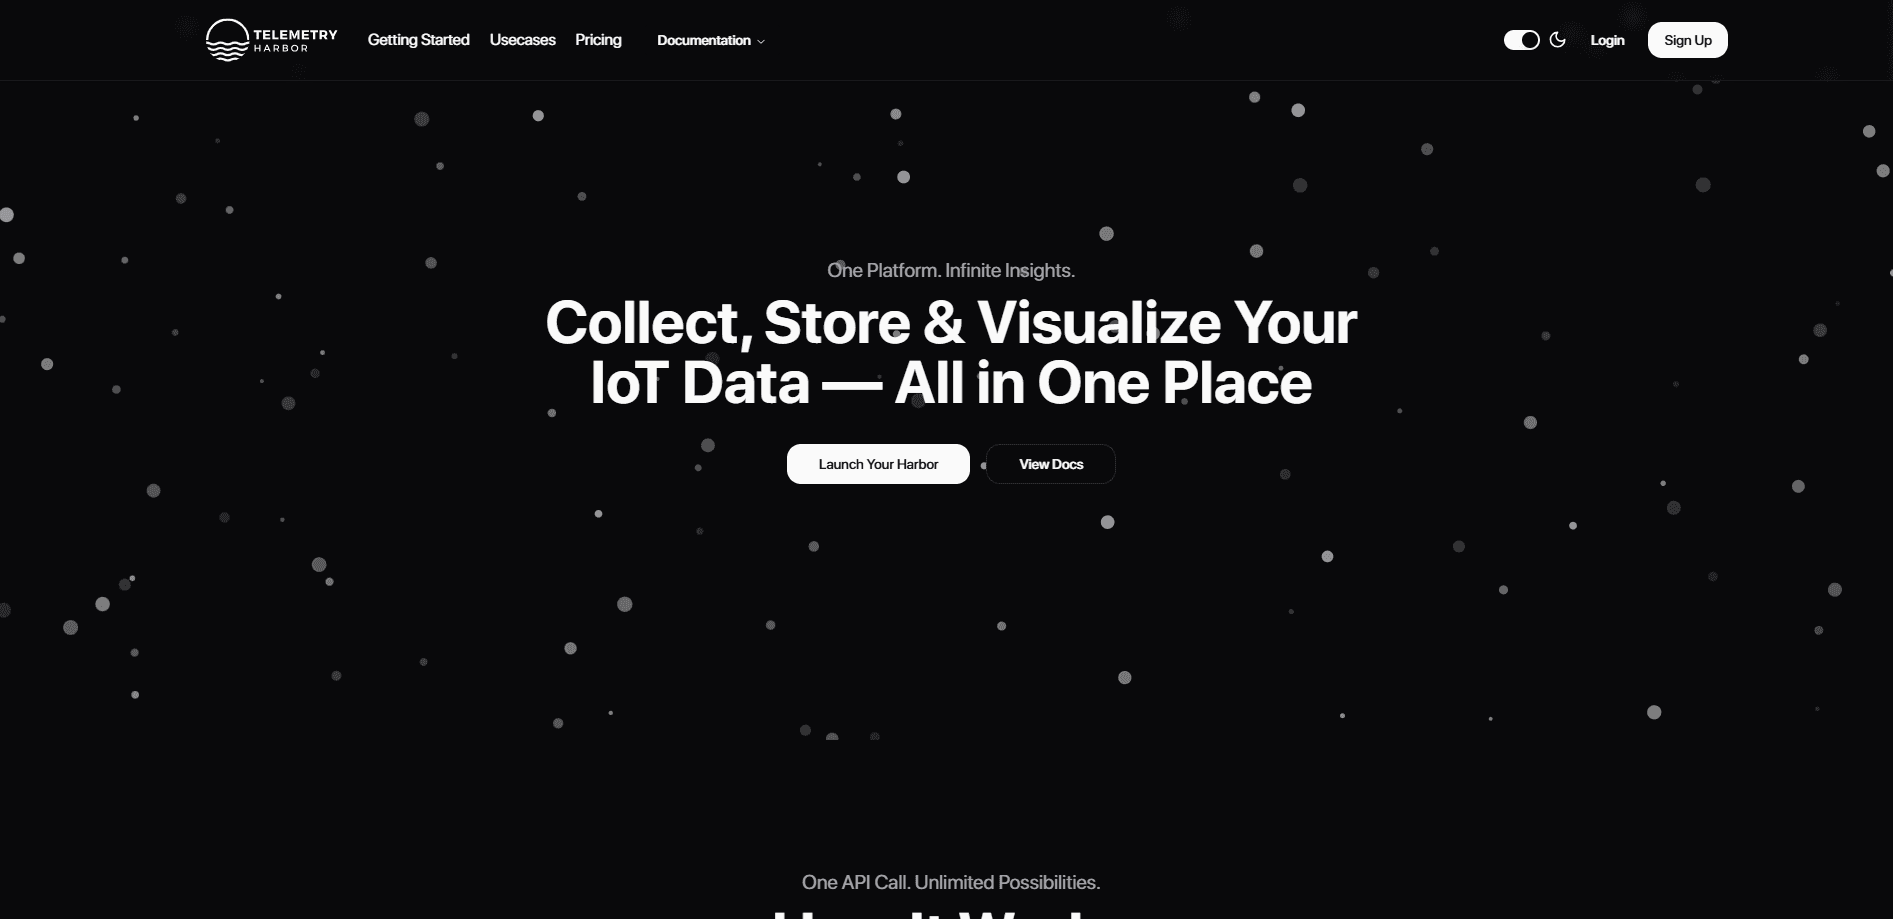
Telemetry Harbor is a managed Grafana and IoT monitoring platform. It streams data from ESP32 sensors, Linux servers, and Docker into ready dashboards with no config files.
About Telemetry Harbor
What Is Telemetry Harbor
Telemetry Harbor, now branded Harbor Scale, is a hosted monitoring service built on Grafana. It collects telemetry from sensors, servers, and containers, stores it as time series data, and shows it on dashboards that are already set up when you log in. The pitch is speed: you install one agent, name your data source, and readings start flowing in under a minute.
The product aims at people who would otherwise wire up Grafana, InfluxDB, and a pile of YAML by hand. Instead of that work, you get a provisioned workspace with dashboards and panels waiting for data. A layer called Harbor AI sits on top, letting you ask questions in plain English and run clustering or regression without writing SQL.
Two limits are worth knowing before you sign up. Tailoring dashboards beyond the defaults still assumes some Grafana familiarity, so it isn't a drag-and-drop builder. And the free tier caps how much data you can store and for how long, which pushes active fleets toward a paid plan.
Getting Started
- Create an account and open your provisioned Grafana workspace.
- Install the Harbor Lighthouse agent on a Linux host, or point an ESP32 device at the ingest API.
- Name the data source; the agent auto-detects services and system metrics.
- Watch readings land on the built-in dashboards, then ask Harbor AI a question in plain English.
Product Information
A quick look at Telemetry Harbor's pricing, supported platforms, and performance.
Best for
The users, tasks, and scenarios where this tool fits best.
Users
- Makers and hobbyists with ESP32 or Raspberry Pi sensors
- Small dev teams running Linux fleets
- Solo developers who need dashboards fast
- Data-curious builders
Tasks
- Monitoring sensor readings over time
- Watching server and Docker health
- Spotting anomalies and trends
- Running quick analysis
Scenarios
- A weekend project logging greenhouse temperature from an ESP32
- A startup tracking a handful of Linux boxes
- A developer testing an idea before building infrastructure
- A team that wants quick charts for a demo
Key features
One Command Agent Install
Harbor Lighthouse is an open-source agent written in Go. You install it with a single command, name the source, and it starts streaming. There are no YAML or .env files to edit, and setup takes seconds rather than hours.
Zero Configuration Collection
The agent auto-detects running services and system metrics. Native collectors for Linux, Docker, and systemd are included, so you don't hunt for libraries or hand-write config. The collected readings land in your workspace already formatted as time series.
Dashboard Ready on Login
Your Grafana workspace arrives provisioned with dashboards and panels. Data flows into them from the first readings, which means you see charts without designing a single panel. You can still edit the dashboards later if you want a custom view.
Harbor AI Plain-English Queries
Harbor AI is a data analyst layer that answers questions in everyday language, with no SQL required. Ask it to run K-Means clustering or a linear regression and it returns results in seconds. Every answer includes the exact query it used, so you can verify the number or reuse it elsewhere.
Generative Visualization
The AI can build charts, heatmaps, box plots, and correlation matrices shaped around the question you asked. Instead of picking a chart type yourself, you describe what you want to see and get a matching visual. That's faster for one-off questions than building a panel by hand.
Anomaly Detection and Forecasting
Beyond charts, the platform forecasts future values and highlights readings that look abnormal. It surfaces trends before they turn into a problem, which helps when you're watching a fleet you can't inspect in person. You get a heads-up rather than a wall of raw numbers.
Pros and cons
Pros
- Setup is measured in seconds, not hours, because the agent needs no config files.
- Dashboards and panels are provisioned before you send any data, so charts appear right away.
- Native collectors for Linux, Docker, and systemd cover common hosts without extra work.
- Harbor AI answers in plain English and shows the query it ran, so results are checkable.
- A free tier lets you test the workflow before paying, and paid plans start at a low monthly price.
Cons
- Custom dashboards still call for some Grafana know-how, so it isn't a pure drag-and-drop builder.
- The free tier limits storage volume and retention, which caps how much history small teams keep.
- Advanced analysis leans on the AI layer, and power users who want raw query control may prefer self-hosting.
- Vendor fit matters: teams already deep in another observability stack may not want to migrate.
Frequently asked questions
It's a hosted monitoring service on top of Grafana. It collects telemetry from sensors, servers, and containers, stores it as time series data, and displays it on dashboards that are ready when you log in.
Related content
Explore related tools, skills, and articles for Telemetry Harbor.
Telemetry Harbor Alternatives

Base Code
Base44 (Wix) · Coding · ProductivityBase Code is a shared cloud development environment from Base44. Teammates describe changes to an existing GitHub codebase in chat, preview them live and send them back as pull requests.

Google EmbeddingGemma 2
Google DeepMind · Writing · Image · CodingGoogle EmbeddingGemma 2 is a 740M-parameter open model that turns text, code, images, audio, and video frames into vectors in one 768-dimension space, running on phones and laptops.
GitGlow
GitGlow · Coding · ProductivityGitGlow is a local-first desktop Git client that lets independent developers review their own code and their AI agents' changes in one place before shipping.