

tracethat.dev
Kacper Pietrzak · Coding
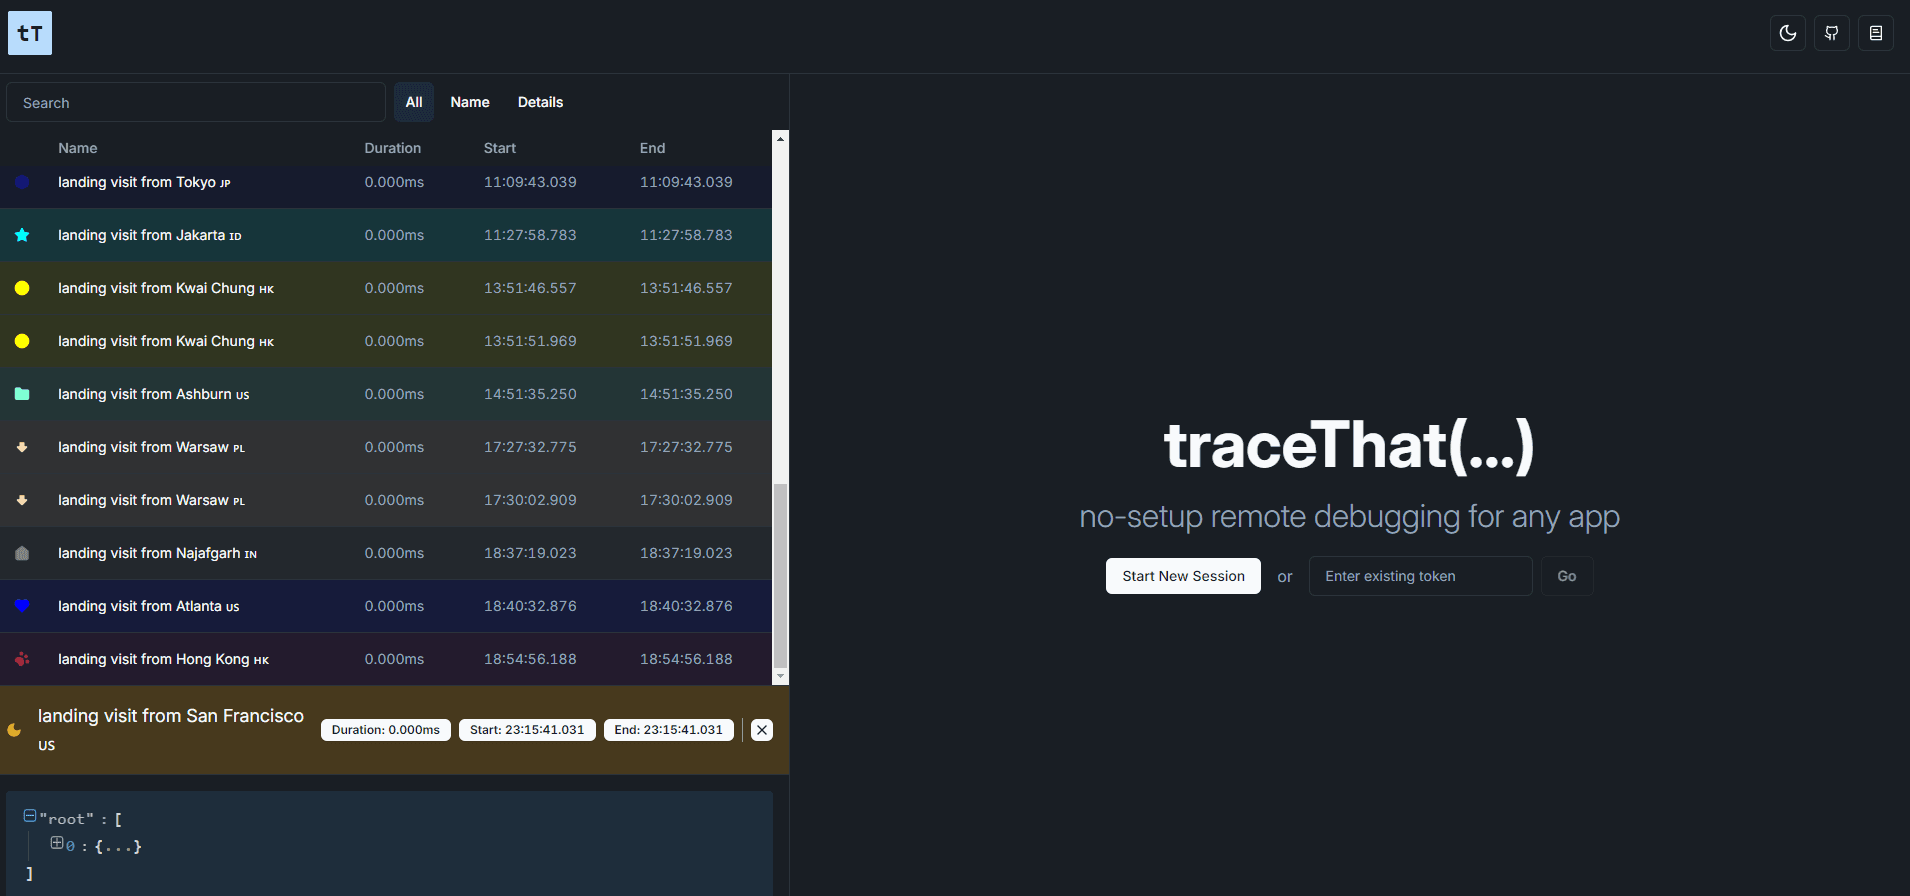
tracethat.dev is a no-setup remote debugging tool that wraps functions in JavaScript, Python, or Go, then streams their arguments, return values, timing, and errors to a live debug UI.
About tracethat.dev
What Is tracethat.dev
tracethat.dev is an open-source remote debugging tool built by Kacper Pietrzak for developers who are tired of scattering print statements through their code. Instead of printing a wall of logs and scrolling through unrelated output, you wrap a function and the tool collects the useful details automatically. It's aimed at teams and solo developers debugging code that runs somewhere they can't easily attach a traditional debugger, such as a remote server, a container, or a background job.
The idea behind it is simple. Print-based debugging forces you to decide in advance what to log, then re-run your code every time you guessed wrong. tracethat.dev flips that around. The reporter captures arguments, return values, running time, call stack, and any exceptions thrown, so one run usually tells you enough to find the problem.
The trade-off is scope. The Go reporter can't wrap arbitrary functions because of how Go's type system works, so Go users log events by hand. Events only live on the server for a while, so this isn't a long-term log archive. And you still have to add the reporter to your code yourself.
Getting Started
- Go to tracethat.dev and start a new session. The site generates a token that acts as both your room ID and your encryption key.
- Install the reporter for your language:
npm install tracethat.dev,pip install tracethat, orgo get github.com/pietrzakacper/tracethat.dev/reporters/golang/tt. - Register the token in your app with
registerToken("your-token")(JavaScript) orregister_token('your-token')(Python). - Wrap the function you want to watch, or log a single event with
tracethat.log, then run your code. - Watch the events stream into the browser in real time, and expand, collapse, or filter them to zero in on what matters.
Product Information
A quick look at tracethat.dev's pricing, supported platforms, and performance.
Best for
The users, tasks, and scenarios where this tool fits best.
Users
- Backend developers
- JavaScript and TypeScript developers
- Python developers
Tasks
- Debugging a function you can't reproduce locally
- Timing slow code paths
- Catching silent exceptions
Scenarios
- A background job on a staging server throws an error you can't reproduce on your laptop; wrapping the step that fails sends the real inputs straight to your browser.
- A web app misbehaves only in production; the script tag reporter drops into your HTML and starts streaming without a build step.
- You're pair-debugging or asking a teammate for help; sharing the session token lets both of you watch the same stream live.
Key features
One-line function tracing
The reporter's core move is wrapping a function so every call gets recorded as a function tracing event. In JavaScript you write traceThat(hello)("world") and the tool grabs the arguments, the return value, how long the call took, the call stack, and any exception thrown. Python uses the same idea through a @tracethat decorator. You get all of that without writing a single print statement.
Live-streaming web UI
Events don't wait for you to refresh. The web client holds a socket to the server and pushes each new event into your room as it happens. You can expand a call to see its full details, collapse the ones you don't care about, and filter by specific values. It's built for reading a focused list of events instead of a scrollback buffer.
Token-based encryption
Your token does double duty as a room identifier and an encryption key. The reporter encrypts each event before it leaves your app, and the web client can only decrypt events if you give it the same token. The room is keyed by the SHA-256 hash of the token, so the server hands your session only the events meant for it.
Multi-language reporters
There are reporters for JavaScript/TypeScript, Python, and Go. The JS reporter installs from npm and can also run from a plain script tag, which is handy when you don't have a build pipeline. Python installs from PyPI. Go installs straight from GitHub. Each one talks to the same server and the same UI, so a mixed stack still lands in one place.
Manual event logging
When you don't want to wrap a whole function, you can drop a marker at a single point. tracethat.log('hello function started') records an event, and you can pass extra data alongside it. That's the go-to option for Go, since its reporter can't wrap functions generically, and for anyone who just wants a checkpoint between two lines.
In-memory server with automatic cleanup
The server keeps events in memory rather than writing them to durable storage, then clears them after a while. That keeps the setup light and means there's no leftover log to manage. It also means events are meant for live debugging, not for reviewing what happened last week.
Pros and cons
Pros
- No setup beyond adding the reporter: you don't configure an agent, a collector, or a storage backend.
- Captured data is broader than print statements and covers arguments, return values, timing, call stacks, and exceptions in one pass.
- The live UI with filtering and expand/collapse makes a run far easier to read than raw logs.
- Open source under the MIT license, so you can read the code, self-host, or contribute.
- Works across JavaScript, Python, and Go, which suits teams with a mixed backend.
Cons
- The Go reporter can't wrap arbitrary functions, so Go users have to log events by hand, which means more manual work than in JS or Python.
- Events are held in memory and cleaned up after a while, so you can't treat it as a durable log for post-incident review.
- You still need to change your source code to add the reporter, so it isn't zero-touch for apps you can't edit.
- It's a small, single-maintainer project with a modest user base, so community support is thinner than with a large commercial platform, and you may end up fixing edge cases yourself.
Frequently asked questions
It's a remote debugging tool for watching what a running app actually does. You wrap functions and the tool streams their arguments, return values, timing, and errors to a browser UI, so you can debug code that's hard to reach with a normal debugger.
Related content
Explore related tools, skills, and articles for tracethat.dev.
tracethat.dev Alternatives

Base Code
Base44 (Wix) · Coding · ProductivityBase Code is a shared cloud development environment from Base44. Teammates describe changes to an existing GitHub codebase in chat, preview them live and send them back as pull requests.

Google EmbeddingGemma 2
Google DeepMind · Writing · Image · CodingGoogle EmbeddingGemma 2 is a 740M-parameter open model that turns text, code, images, audio, and video frames into vectors in one 768-dimension space, running on phones and laptops.

GitGlow
GitGlow · Coding · ProductivityGitGlow is a local-first desktop Git client that lets independent developers review their own code and their AI agents' changes in one place before shipping.