

Autoplot
Kaya Aykut · Image · Coding
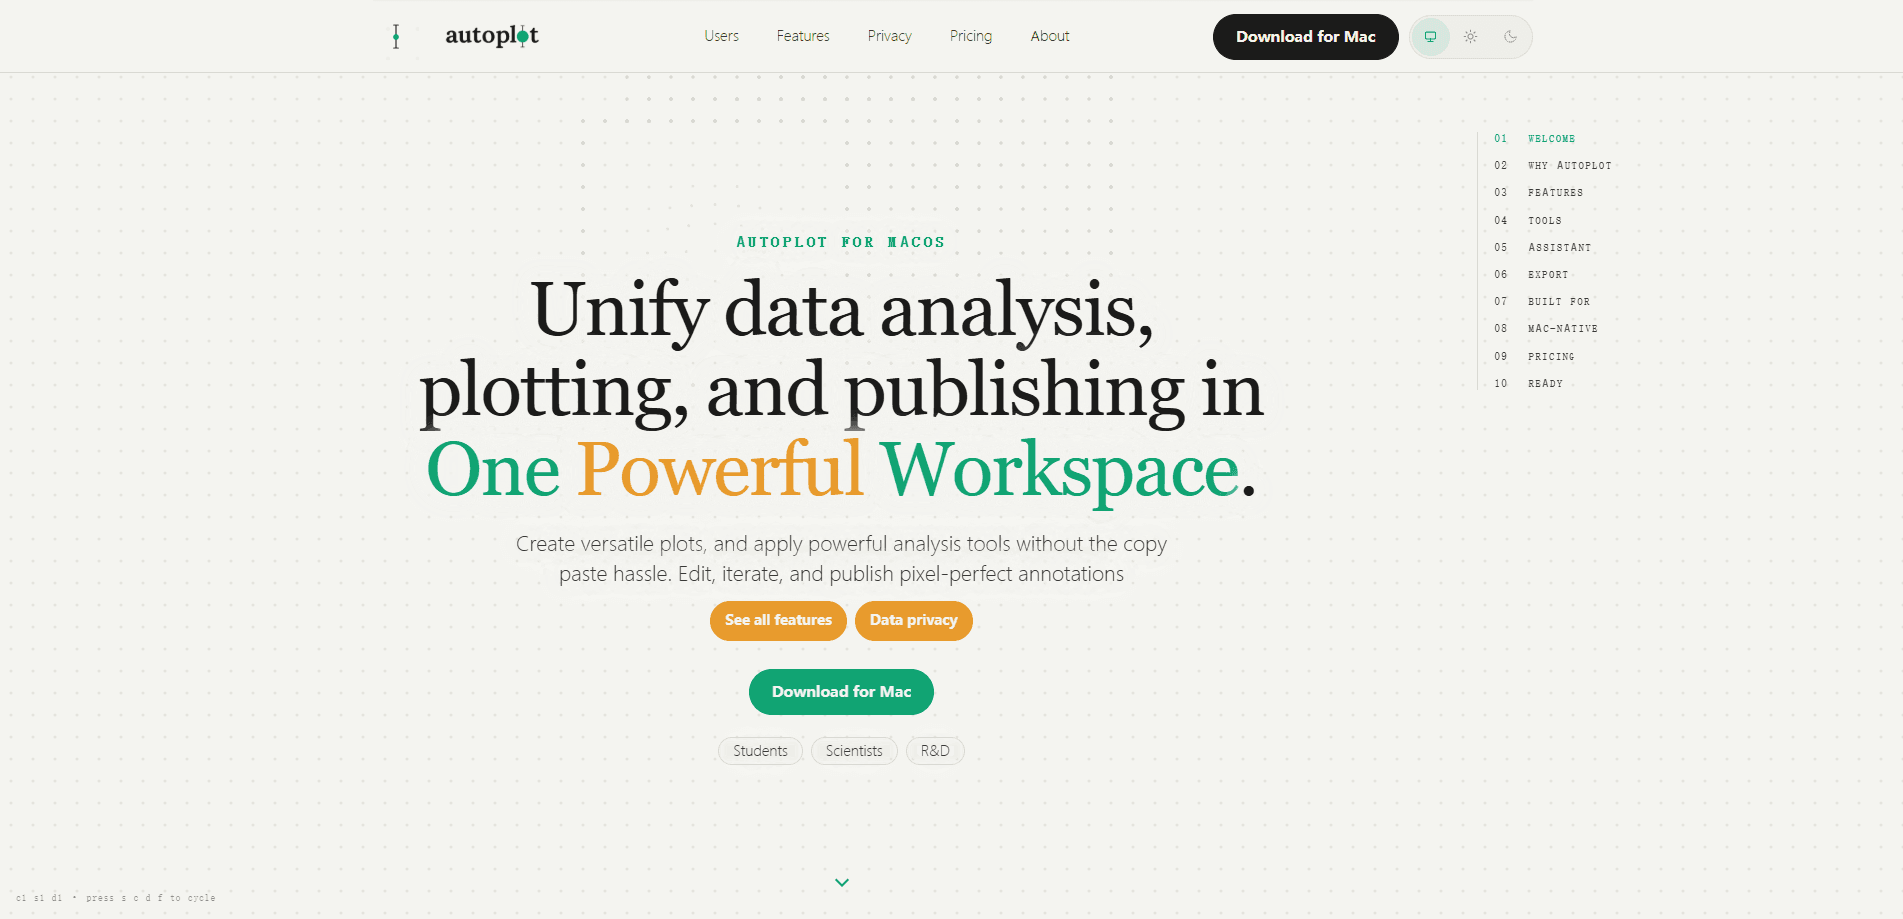
Autoplot is a native, local-first macOS workspace for scientific plotting and data analysis. It handles tabular data from import to export: parsing messy files, creating reusable variables, building 2D and 3D figures, running distribution and power-law fits, and exporting print-ready vector PDFs. Unlike browser-based tools, it keeps your raw data on disk and runs the scientific Python stack offline.
About Autoplot
What Is Autoplot
Autoplot is a Mac app built for anyone who plots their own experimental data. It's scientific plotting software that follows tabular data through the whole workflow: parsing columns, defining variables, building cards for plots and fits, composing boards, and exporting figures that hold up under peer review. The tool targets the gap between a Jupyter notebook and a legacy statistics package, and both have real costs. Both work. Neither is tuned to macOS or to the way a researcher actually moves from raw numbers to a finished figure.
As a data visualization Mac users can trust, its biggest edge over a notebook is momentum. You drag in files, fix the parse with a live preview, and merge them into one project without writing code. From there, variables carry forward. Every plot and fit reuses the same column names instead of re-deriving them each session. Why does that matter? Because re-deriving columns is where notebooks quietly eat your afternoon. The app also runs NumPy, SciPy, and Matplotlib inside itself, so core analysis and export keep working with no internet connection.
The clearest limit is the platform. This macOS plotting app is macOS only, built for Apple Silicon, so Windows and Linux users are out. It's also narrower than a general data-science environment. It starts from tabular data and stays close to it, which is a strength for figure work and a constraint if your project leans on deep learning or database pipelines. Pricing is subscription-based for the higher tiers, and the AI assistant draws from a monthly credit pool rather than running unlimited.
Getting Started
- Download the Mac build from autoplot.ai and open the app. The Free tier needs no payment method.
- Drag a CSV, TSV, or delimited text file into a project. Set the delimiter, header row, and encoding, then check the live preview before you commit.
- Name the parsed columns as variables. Derive, filter, or split them, and reuse the same variables across every later card.
- Add a plot card: X&Y, histogram, heat map, or 3D scene. Overlay series, fits, and summaries in one figure.
- Export as a vector PDF at journal DPI with embedded fonts, or save the project and reopen it later.
Product Information
A quick look at Autoplot's pricing, supported platforms, and performance.
Best for
The users, tasks, and scenarios where this tool fits best.
Users
- Graduate students and postdocs
- Working scientists
- R&D and industry analysts
Tasks
- Building publication-ready figures
- Distribution and power-law analysis
- Cleaning and reshaping messy data
Scenarios
- Rebuilding a figure after a referee asks for a different axis range, without re-running a whole notebook.
- Analyzing large CSVs straight from disk, where a browser tab would stall on the array size.
- Working offline on a laptop during travel, with the local toolkit fully functional and no data leaving the machine.
Key features
Native Import Without Code
Autoplot parses headers and merges multiple files through a graphical import flow. You set the delimiter, header row, skipped rows, and encoding, then check a preview table before anything becomes data. Batches of files collapse into one structured project, so a folder of per-run CSVs becomes a single analysable dataset. When the parse is wrong, you fix it in the preview instead of debugging a script, which saves the kind of hour that usually disappears into a traceback you didn't ask for.
Variables That Carry Across Every Card
Parsed columns become named, durable variables that every plot, fit, and workspace can reference. You can derive, filter, and split them, and batch-create across many files at once. This is where the app saves the most time over a notebook: define a column once, and every later figure reuses the same vocabulary. No re-deriving the same column in a new cell. Define it once.
2D and 3D Plot Surfaces
X&Y plots cover scatters, lines, step, bars, stem, lollipop, area, and ribbon styles, with dual axes and in-card running averages or smoothing. Histograms show density-normalized distributions with Gaussian-mixture or custom fits. For 3D data, the same x, y, z values render either as a flat heat map with contours or in a true 3D scene. Every figure overlays as many series and analysis outputs as you need. Change one card and the whole board follows. For 3D work, newer builds support up to 500,000 scatter or animated path points with safer editing, which is enough for the particle and field datasets that would choke a lighter plotting app.
Publication-Ready Export
Change a card and the figure follows, with no re-running a script and no third-party tools in the loop. Export produces vector PDF at journal DPI with embedded fonts, plus PNG and JPG. Newer builds also export any figure as an editable Matplotlib Python script with its data attached, so you can keep refining outside the app. That path matters when a journal or collaborator wants the raw plotting code.
Distribution and Power-Law Analysis
The analysis surfaces go past basic stats into methods that specific fields depend on. Free covers PDF and log-binned distributions with power-law analysis. Higher tiers add CDF/CCDF, x_min diagnostics, finite-size-scaling collapse, and E–S scaling. If your paper leans on heavy-tailed data, the tools you'd normally hand-code are built in as named operations.
The Privacy-First AI Assistant
The assistant reads your intent and dataset schema, never your raw values, and applies an open-weight model hosted on DeepInfra's U.S. infrastructure. It writes Python you review line by line before anything runs, and file operations stay sandboxed to a folder you choose. You can chain a request into a full task: import a file, derive a variable, build a plot, annotate it, and export, all from one plain-language instruction. Disabling the assistant leaves the non-AI toolkit untouched.
Native, Offline Engine
Autoplot is a real SwiftUI app for Apple Silicon, not a web page in a window. Documents launch fast, scrolling is native, and large CSVs open straight from disk with no browser size ceiling or upload step. The scientific Python stack runs inside the app, so imports, fits, plots, Compose, and export all work with no connection. Only the hosted assistant, account, and billing paths need the network.
Pros and cons
Pros
- Raw data stays on the Mac. The assistant sees schema and intent, not values, which clears the bar for many NDAs and ethics reviews.
- Variables persist across the project, so you define a column once and reuse it in every figure and fit.
- Vector PDF export at journal DPI with embedded fonts, plus a Matplotlib script export for anyone who needs the underlying code.
- Core plotting and analysis run offline, which helps on flights, in labs with locked-down networks, or anywhere a cloud tool would stall.
- A genuinely free tier covers X&Y plots, histograms with fits, power-law analysis, and export with no time limit.
Cons
- macOS only, and tuned to Apple Silicon. There is no Windows or Linux build, so mixed-platform teams can't standardize on it.
- The AI assistant runs on credits, not unlimited messages. Free and Plus both cap at 10 hosted-AI credits per month, which goes quickly if you lean on it.
- The scope is deliberately narrow. It handles tabular scientific data well but won't replace a full data-science environment for deep learning or database work.
- Higher plot and analysis surfaces sit behind the Plus and Pro tiers, so the free plan is genuinely entry-level.
Frequently asked questions
Yes. The local toolkit, including imports, fits, all plot surfaces, Compose, and export, runs offline. Only the hosted assistant, account, waitlist, and billing paths need network access, so a locked-down lab network or a long flight won't stop you from finishing a figure. You can also disable the assistant entirely without losing the rest of the app.
Related content
Explore related tools, skills, and articles for Autoplot.
Autoplot Alternatives

X Ray Interpreter
X-ray Interpreter · ImageX Ray Interpreter is a web-based AI radiology tool that turns X-rays, CT scans, MRI, ultrasound, and PET images into plain-language reports. You upload a scan, get a preliminary X-ray interpretation in moments, then ask follow-up questions if something needs explaining. It works as a second opinion and a learning aid, not as a medical diagnosis.

Aieasypic
AIEasyPic · ImageAIEasyPic is an AI image generator that turns plain text prompts into finished artwork in seconds. You can also train custom models on your own photos, swap faces in existing images, and create short video clips from text, all from a browser. It suits casual creators who want quick visuals and hobbyists who want to build a personal model without touching any code.

Chargen
Chargen · ImageChargen is an AI character generator and worldbuilding toolkit built for Dungeons & Dragons and other tabletop RPGs. It turns a one-line idea into a painted character portrait, spins up NPCs, monsters, maps and encounters from the same session, and keeps every creature's details close at hand. The tabletop RPG art side runs on a credit system called Gold, while the text generators stay free for everyone.