

Tractionwave
TractionWave · Image · Marketing
TractionWave is an AI attention heatmap tool for static ads. Upload a PNG or JPG and it returns predicted attention, ranked hotspots, and fixes before you spend budget.
About Tractionwave
What Is TractionWave
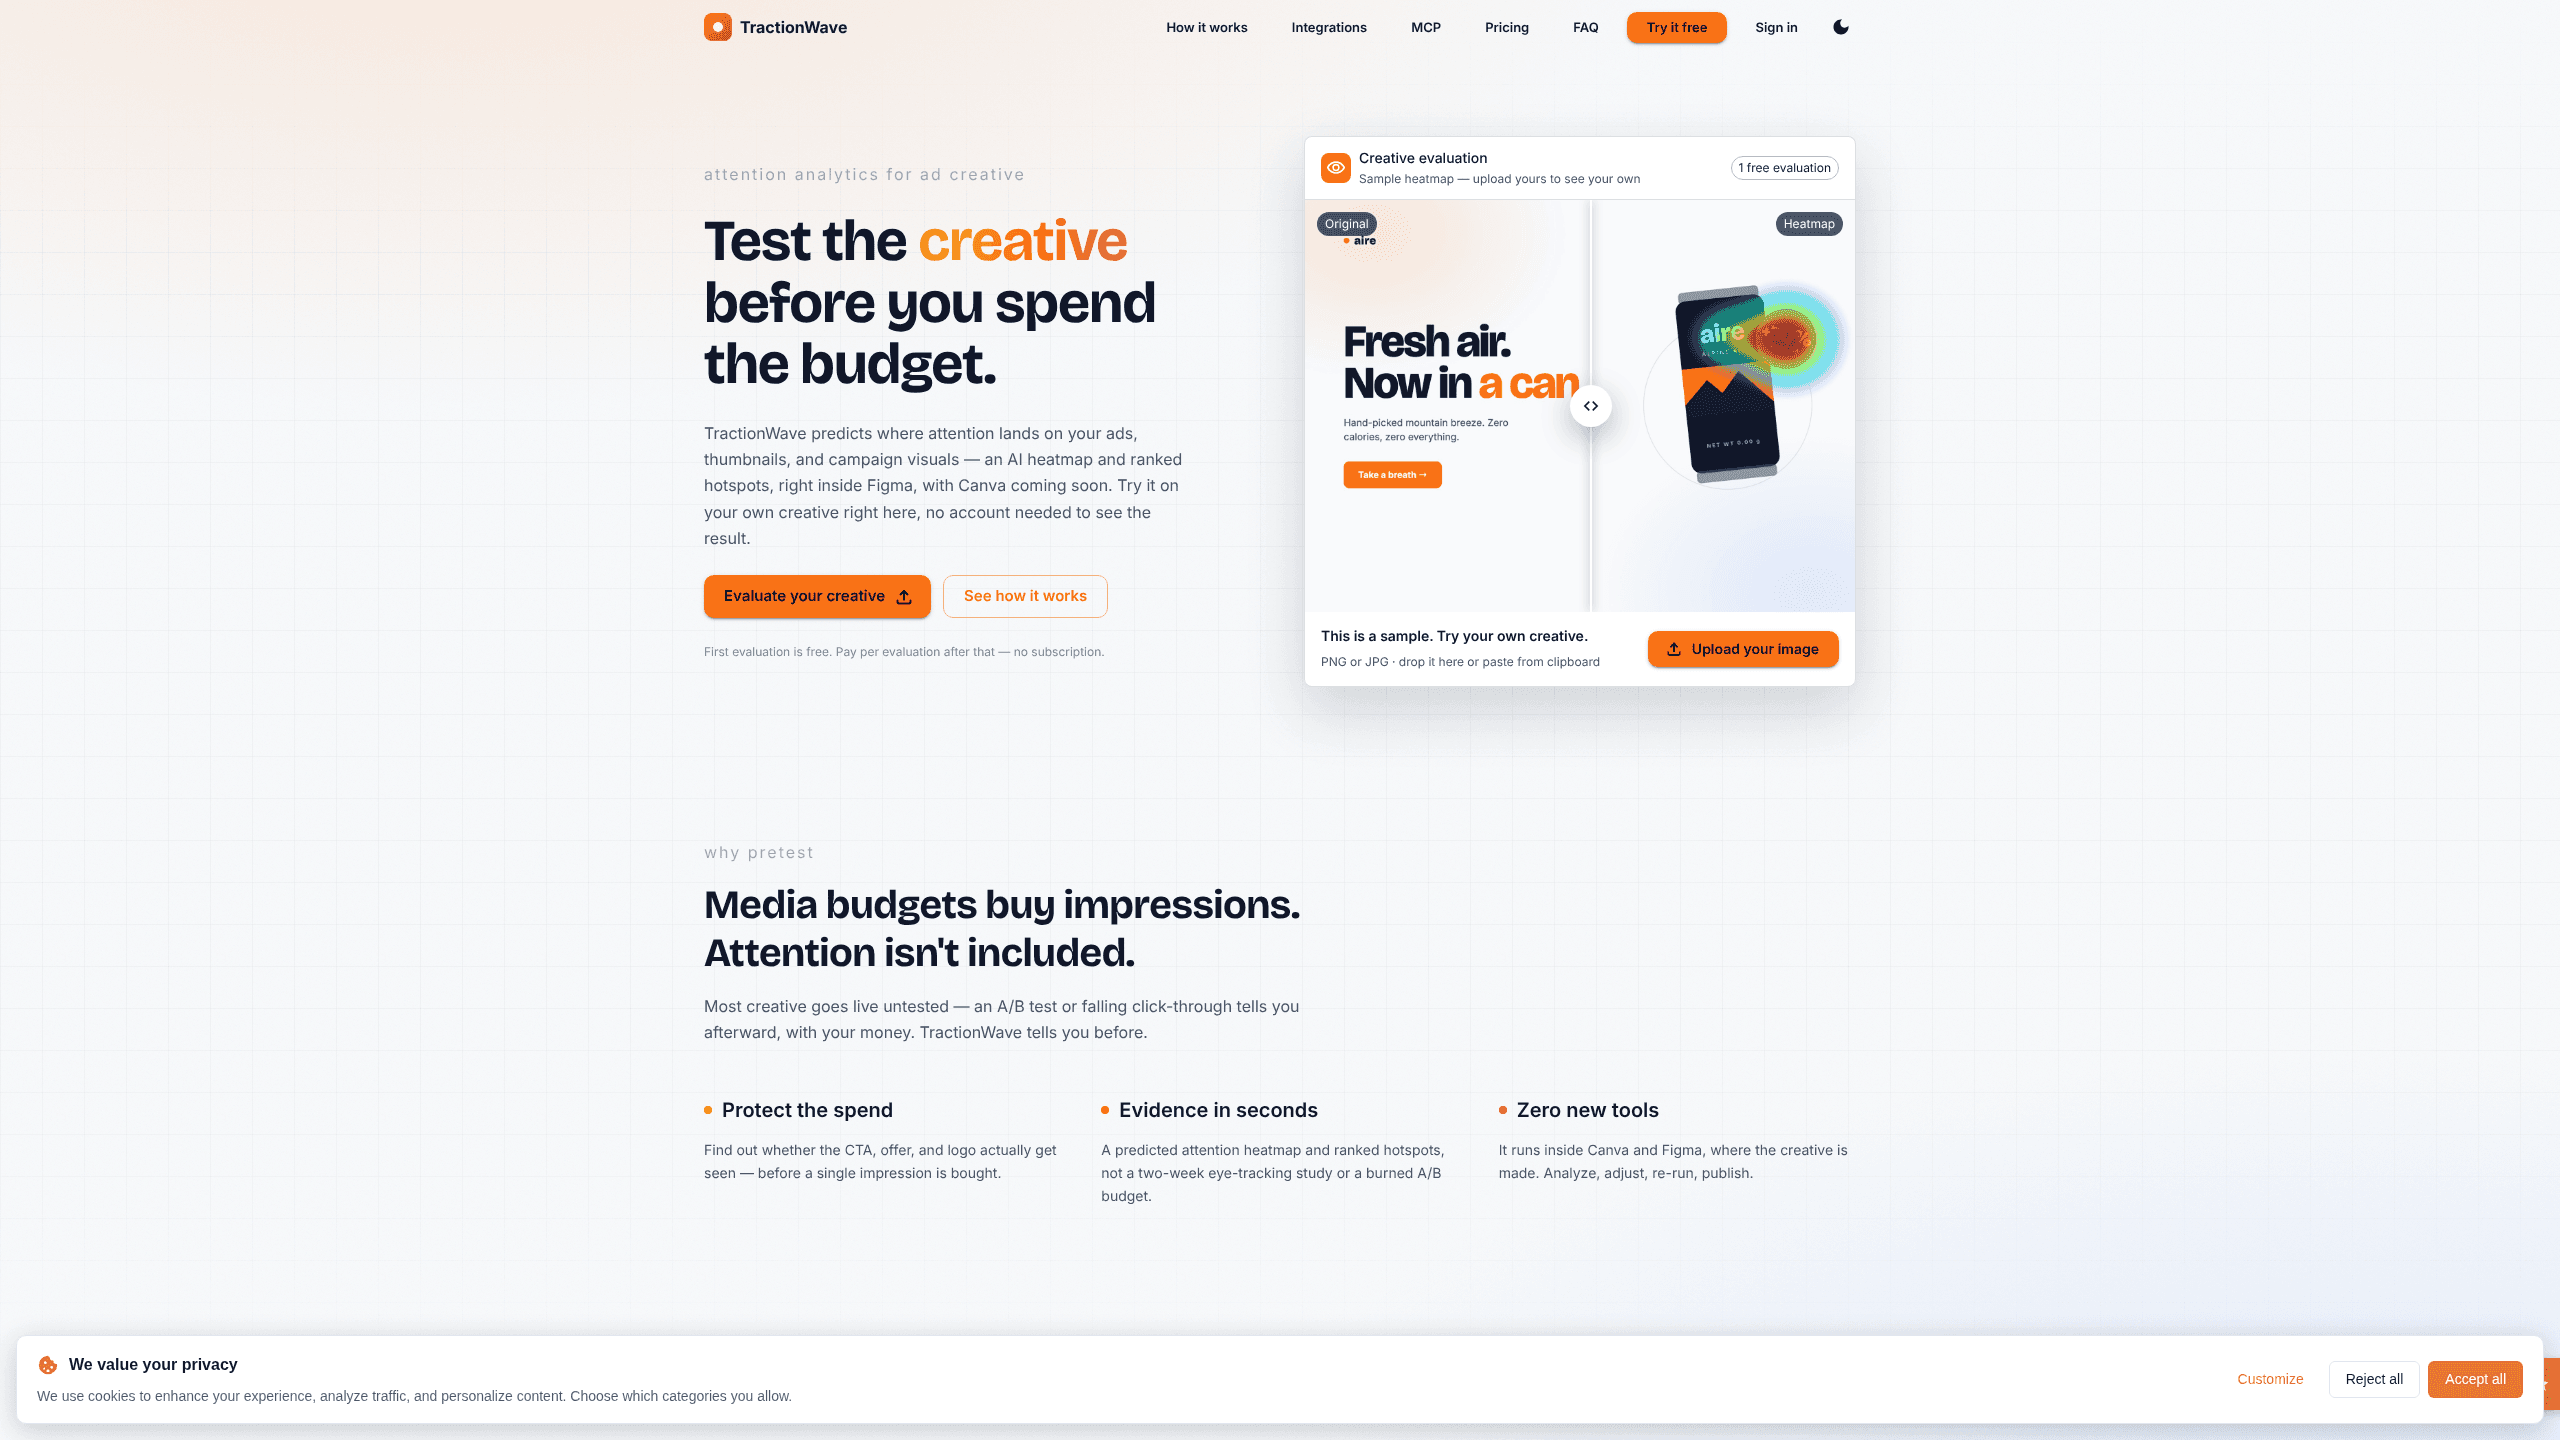
TractionWave predicts where eyes land on a still ad. You upload the finished creative, the model returns a color overlay of predicted attention, and a ranked list points at the parts that lose the viewer. It runs in the browser, inside Canva and Figma, or through an MCP connection to an AI agent.
The problem it addresses is old. Media budgets buy impressions, and an impression says nothing about whether anyone looked at the call to action. A real eye-tracking study answers that with a recruited panel and a two week schedule. The idea here is to predict ad attention from the image alone, and TractionWave's claim is that a diffusion model trained on interaction data gets close enough to support a decision in minutes.
Scope is narrower than the pitch suggests. Only static visuals go in today. There's no campaign data, no A/B result, no audience segment, so you're looking at attention rather than conversion. Attention prediction of this kind tells you where the eye goes, not what the eye does next, and AI ad analysis is only worth the cost when the answer changes a decision. That distinction matters when two offers look equally good on a heatmap and only one sells.
Getting Started
- Open tractionwave.com and drop a PNG or JPG into the panel, or paste one from the clipboard. The first evaluation needs no account and arrives with a watermark.
- Create a free account with Google or an email code. The second run is free and comes without the watermark, and your history is saved.
- Read the heatmap first, then the hotspot list. Each ranked item is pinned to a numbered region on the creative.
- Buy a credit pack when the free runs are gone, or connect Canva, Figma, or an MCP client to run evaluations where you already work.
- Download the heatmap PNG or the branded PDF report for the client or the media buyer.
Product Information
A quick look at Tractionwave's pricing, supported platforms, and performance.
Best for
The users, tasks, and scenarios where this tool fits best.
Users
- Performance marketers
- Freelance designers
- Agency teams
Tasks
- Checking whether the CTA survives a busy layout
- Comparing two directions
- Judging a thumbnail or social post before it goes out
Scenarios
- The final banner lands on Friday and the campaign starts Monday
- A client asks why the last ad underperformed
- A designer is deep in Figma
Key features
Predicted Attention Heatmap
Drop in a PNG or JPG and TractionWave renders a heatmap over the creative, with warmer areas marking where the model expects eyes to settle first. The company describes the underlying model as a diffusion model trained on interaction data, and the output reads like a gaze plot: bright where the eye stops, dark where it skips. Uploads are deleted after 24 hours, and your designs are not used to train any model.
Ranked Hotspots and Fixes
A heatmap alone leaves you guessing. Each evaluation also returns numbered regions and a ranked list of changes, ordered by estimated impact. That ordering is the useful part in a review, because it tells you whether the headline, the product shot, or the CTA is the first thing to fix instead of handing a designer ten notes at once.
Branded PDF Report
The report packs the original ad, its heatmap, a plain language summary, the attention path, and the ranked recommendations into one PDF. Add your name, logo, and brand color and it goes to a client as your work. A report costs 2 credits per insight, and you can download it again whenever you need a fresh copy.
Canva App
The Canva attention app runs from the Apps panel inside the editor. Sign in once and it uses the credits on your TractionWave account; each page costs 1 credit, and failed runs are refunded. Analysis happens on the page you're editing, so there's no export step between the design and the verdict.
Figma Plugin
Inside Figma the plugin works on the frames you select, or on every frame in the page if you select none. Each frame costs 1 credit. The heatmap comes back as a layer you can toggle, which makes version comparison straightforward: duplicate the frame, change the layout, run it again, then switch the overlay on and off.
MCP Server for AI Agents
The MCP server exposes one tool, predict_attention. Connect it to Claude, Claude Code, Cursor, or VS Code through OAuth, then ask your agent to evaluate a screenshot and the ranked hotspots come back in the conversation. Access sits on a single screen where you can revoke any connected agent, and no API keys get copied around.
Pros and cons
Pros
- The first run needs no account and arrives watermarked, and the second is free and clean, so you can judge the output on your own creative before paying.
- Credits never expire, there's no subscription, and the per credit price falls from $2 on Starter to $0.50 on Scale.
- Evaluations run inside Canva and Figma, which keeps ad creative testing in the tool where the design already lives.
- Every report names the regions to change and ranks the fixes, which is easier to defend in a client call than a screenshot of a heatmap.
Cons
- Static visuals only. Video attention is announced but not available yet, so video teams have to export frames and treat each one separately.
- TractionWave publishes no accuracy benchmark against measured eye-tracking data, so the heatmap works as a comparison tool and a ranking is not a measurement.
- One image takes 2 to 3 minutes and the tab has to stay open, which is slow when a batch of twenty banners needs a review.
- PDF reports and Canva runs draw on the same credit balance, so heavy reporting and multi page designs use up a pack faster than the headline credit count suggests.
Frequently asked questions
It predicts where people look on a static ad and tells you what to change. You upload a PNG or JPG, and the output is a heatmap plus a ranked list of fixes, with an optional PDF report for clients.
Related content
Explore related tools, skills, and articles for Tractionwave.
Tractionwave Alternatives

Google EmbeddingGemma 2
Google DeepMind · Writing · Image · CodingGoogle EmbeddingGemma 2 is a 740M-parameter open model that turns text, code, images, audio, and video frames into vectors in one 768-dimension space, running on phones and laptops.
Imejis.io
Imejis.io · Image · MarketingImejis.io is an AI design studio for agents and marketing teams. Describe an image in plain words, and it writes the copy, builds the layout, reflows it to every size, then exports a finished file.

Layoutr
Van Dijk Ontwikkeling · Image · China AILayoutr is a browser floor plan tool that scales your own plan, places furniture at true size, shows the room in 3D and renders it with AI.