

Bricks
Bricks · Productivity
Bricks is an AI data analyst that turns spreadsheets, CSVs, and PDFs into polished dashboards and reports in seconds, built for anyone tired of manual chart work.
About Bricks
What Is Bricks
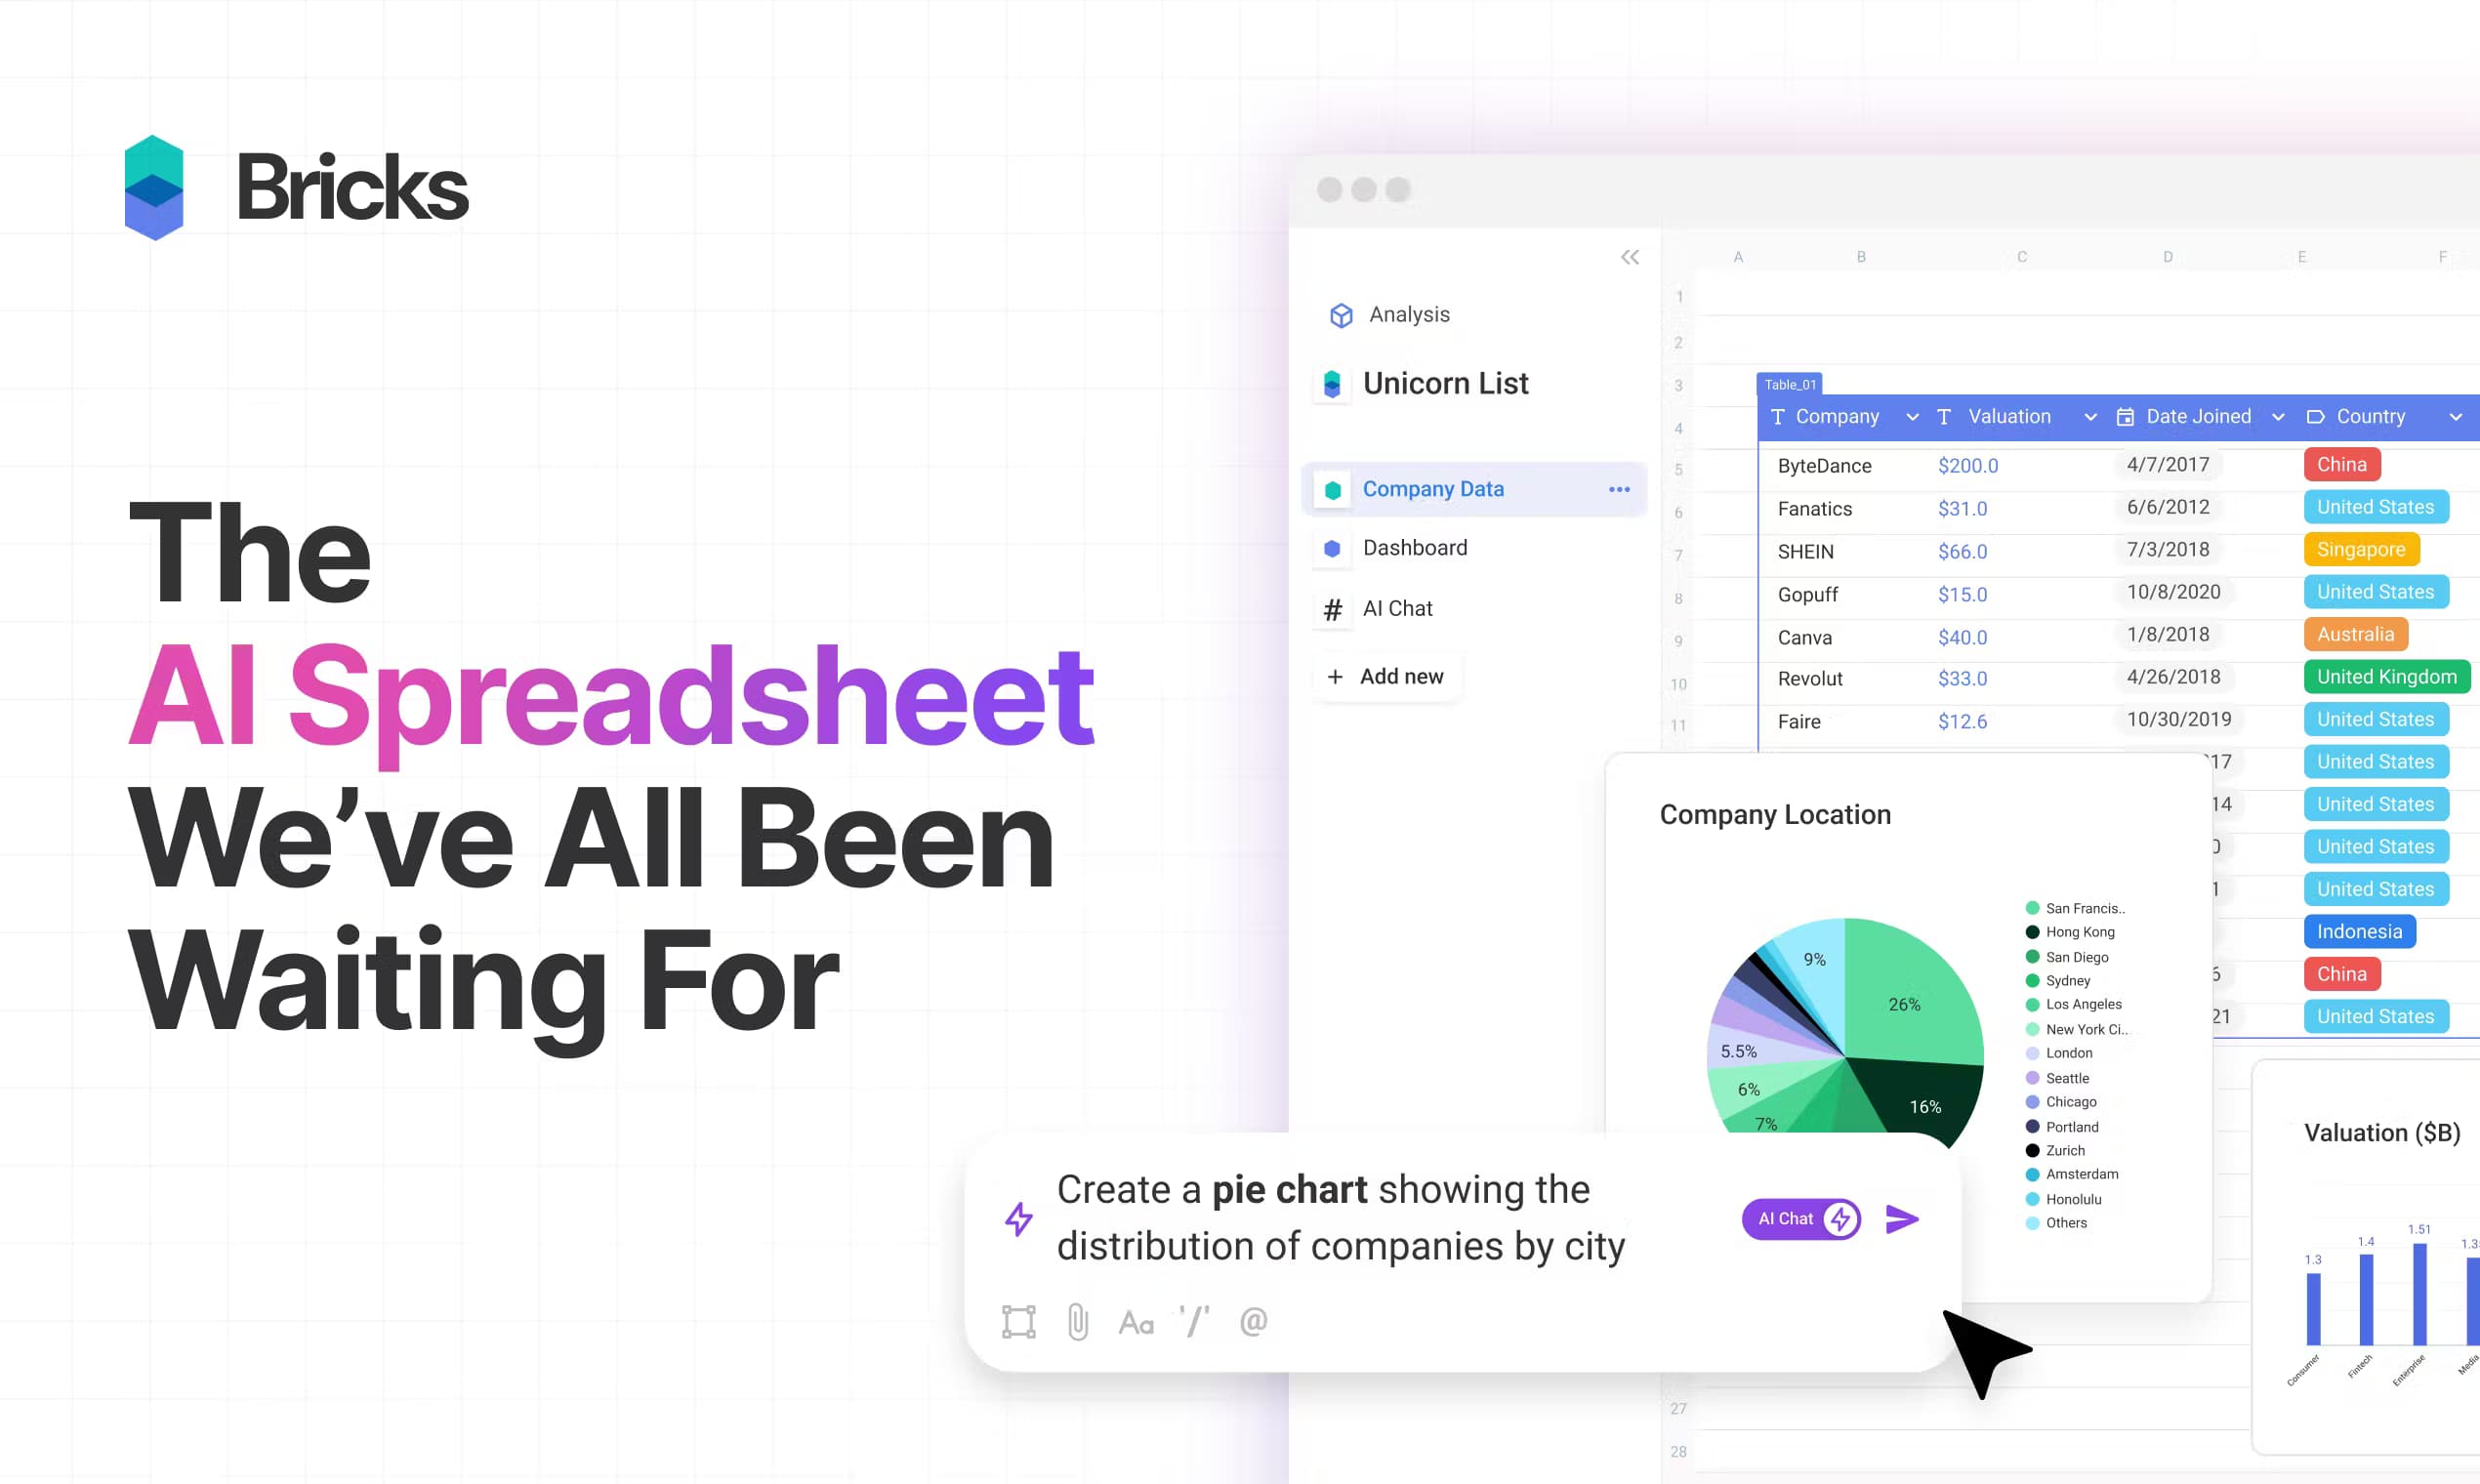
Bricks is a web-based AI data analyst for people who need good-looking dashboards but don't want to learn a business intelligence suite. Upload a spreadsheet, and it reads your columns, picks sensible chart types, and lays out a full dashboard you can send to a client or your team.
The problem it solves is narrow and real. Canva makes pretty visuals but turns painful the moment you need five charts instead of one. Tableau and Power BI can do anything, yet most people never get past the setup. Bricks sits in the middle: easy enough for a manager who lives in spreadsheets, capable enough to handle a monthly reporting pack.
Its main limit is the message counter. AI actions draw on a monthly quota, so heavy users on cheap plans hit a wall and have to wait for a reset or pay for more. Manual editing keeps working, but the automation stops until your messages refresh.
Getting Started
- Sign up at app.thebricks.com with an email address, or use a Google account if that's faster.
- Upload a data file, such as a CSV, Excel workbook, PDF, or image, from the dashboard screen.
- Let Bricks analyze the data and generate a starter dashboard with charts, tables, and KPIs.
- Edit with natural language, like "add a bar chart by region," or drag and drop blocks by hand.
- Apply a theme, then export to PDF or PowerPoint, or share a secure link.
Product Information
A quick look at Bricks's pricing, supported platforms, and performance.
Best for
The users, tasks, and scenarios where this tool fits best.
Users
- Managers and analysts who build recurring reports
- Small marketing and ops teams
- Freelancers and agencies
Tasks
- Turning a CSV export into a shareable report
- Building a data visualization tool you'll actually keep using
- Monthly reporting packs
- Presenting numbers to executives
Scenarios
- Weekly performance reviews with a handful of core metrics
- Early-stage data exploration
Key features
Instant Dashboards From Any Data File
Bricks accepts CSV, Excel, PDF, and even image files, then builds a complete dashboard on its own. You get charts, tables, and KPIs without touching a chart wizard. No setup. No chart picking. For anyone who's spent an afternoon formatting pivot tables, the time saving is the whole point. It's one of the few AI dashboards that skips the boring middle step.
AI Analysis and Storytelling
Each visualization comes with written analysis, not just a picture. Bricks calls out trends and takeaways you might otherwise miss. That matters when you have to explain a number in a meeting rather than just display it. A plain chart can't do that. A solid AI reporting tool should.
Natural Language Editing
You can ask for changes in plain English, like "make this a line chart" or "break this down by region." It's the same idea as talking to ChatGPT, except the edits land directly on the dashboard instead of in a chat window. Type. Done.
Manual Control Over Every Element
AI gets you most of the way, but you keep the last word. Drag, drop, resize, and restyle any block by hand. That mix matters because AI layouts are a starting point, not always the finish line. Any decent dashboard tool needs both.
One-Click Refresh
Swap in new data and Bricks regenerates the charts while keeping the layout you approved. Monthly reporting becomes a re-upload rather than a rebuild. Big difference.
Reusable Templates
Save a dashboard layout and apply it to fresh data again and again. If your reporting follows the same shape each period, you set it up once and stop thinking about it.
Flexible Export and Sharing
Send dashboards out as PDF or PowerPoint, share a secure link, or present straight from Bricks. You aren't locked into the platform to get your work in front of people.
Pros and cons
Pros
- Turns raw CSV, Excel, and PDF files into finished dashboards in seconds, which is the fastest path for anyone without BI training.
- The AI writes analysis for each chart, so you get talking points, not just visuals.
- Natural language editing plus drag-and-drop covers both quick tweaks and fine-grained control.
- Exports to PDF and PowerPoint, so dashboards fit existing workflows instead of forcing everyone into a new tool.
- A free tier with 20 AI messages a month is enough to test whether it fits your data.
Cons
- AI actions count against a monthly message quota, so busy months on the Free or Premium plan can leave you waiting for a reset.
- It's built for smaller spreadsheet datasets; teams with heavy database needs will still want a full BI platform.
- Everything runs in the browser, so there's no dedicated desktop app for offline work.
Frequently asked questions
Bricks turns spreadsheet-style data into dashboards and reports. You upload a file and it generates charts, tables, and written analysis, which you can then edit and share.
Related content
Explore related tools, skills, and articles for Bricks.
Bricks Alternatives

Udon
Udon · Coding · ProductivityUdon turns an Apple Silicon Mac into a home server you run from a browser, with container controls, file shares, and an optional AI sysadmin.

offstage
offstage cloud · Coding · Productivityoffstage gives AI coding agents and CI jobs a real Mac: a fresh macOS account on Apple silicon, driven over an API and billed by the second.

BotBus
Chengdu Tuyang Tusen Technology Co., Ltd. · Coding · ProductivityBotBus lets you control AI coding agents from your phone and watch: approve commands, start tasks and read results while the code stays on your desktop.