

BTInsights
BTInsights · Business
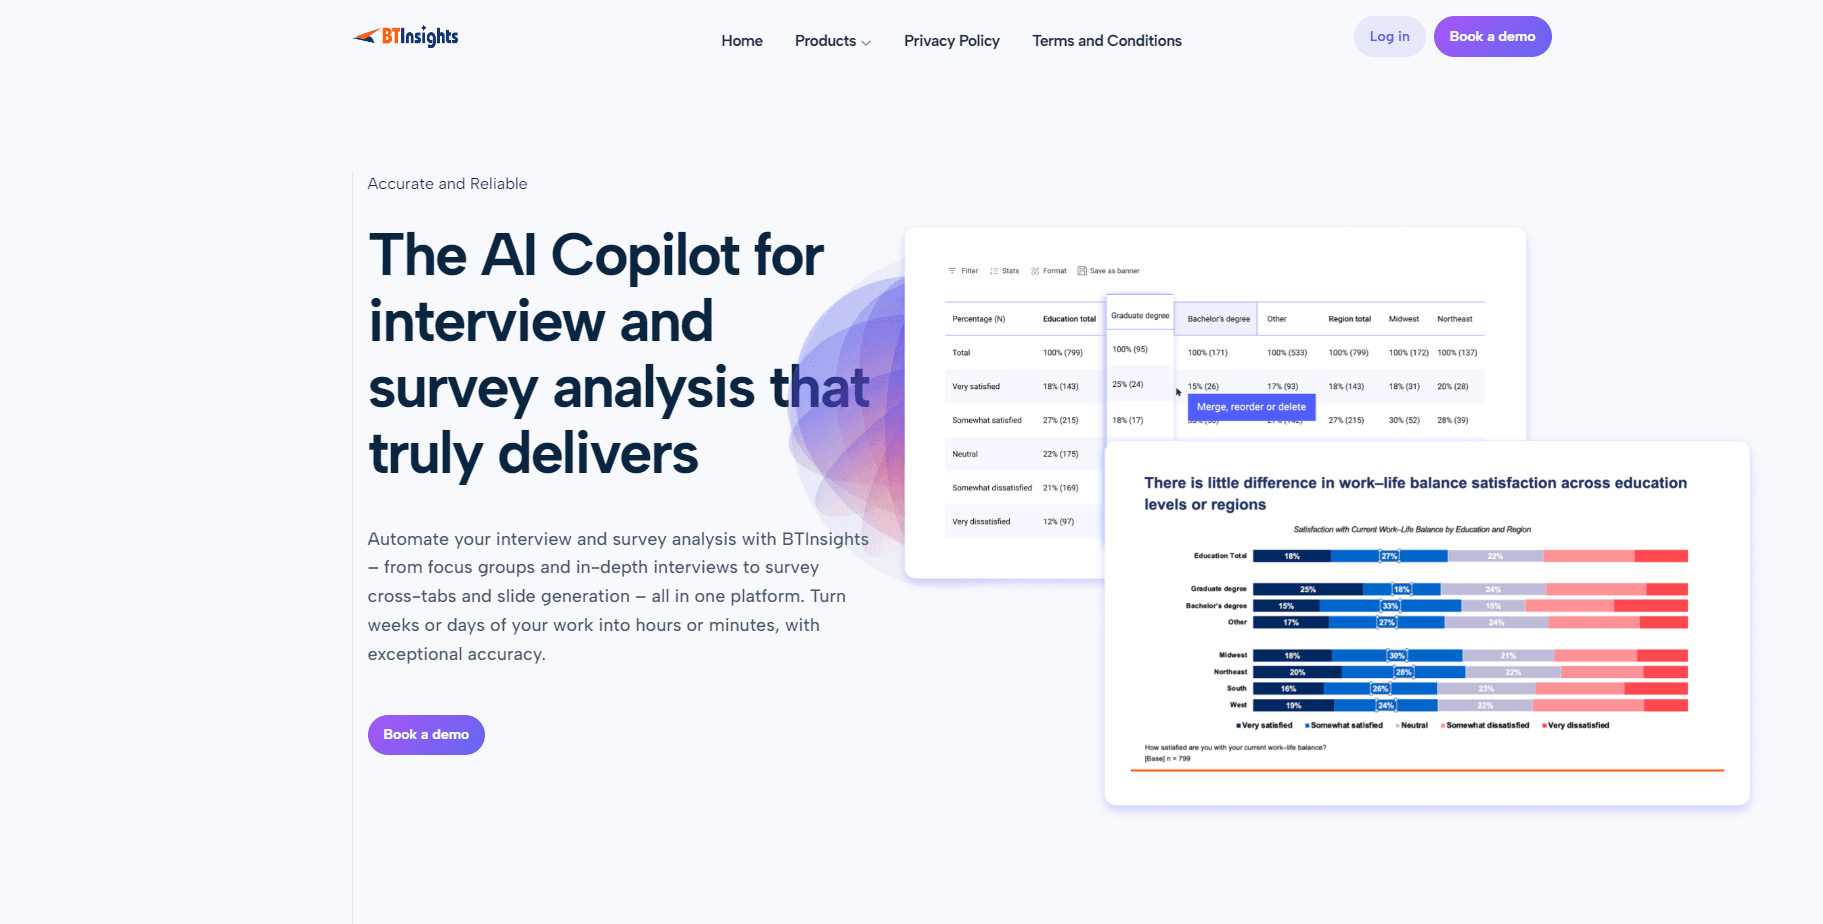
BTInsights is an AI copilot for interview analysis and survey analysis that compresses weeks of manual research work into minutes. It handles the whole qualitative research pipeline, from focus groups and in-depth interviews to survey cross-tabs and slide generation, all inside one platform. You upload your recordings or survey data, and the tool transcribes, codes, and pulls themes out of it, then hands you charts and decks you can present. It's aimed at researchers, marketers, and product teams who run a lot of open-ended data but don't have the headcount to code it by hand.
About BTInsights
What Is BTInsights
BTInsights is a web-based research platform that puts an AI copilot on top of the messy part of market research: making sense of what people actually said. Instead of paying a team to tag transcripts line by line, you feed in interviews, focus group sessions, or survey responses and let the platform do the first pass. It handles the analysis that eats up weeks of a research cycle, so the humans on the team spend their time on judgment calls rather than transcription.
The core promise is speed. The company says it turns weeks or days of work into hours or minutes, with accuracy it describes as exceptional. That claim matters most for teams running continuous research, where a backlog of transcripts quietly piles up because nobody on the team has the time to sit down and code them properly. The platform bundles transcription, thematic coding, cross-tabulation, and deck output. That kills the copy-paste tax. You stop stitching together five separate tools to reach a client-ready finding.
The honest limits sit around control and oversight. AI coding is fast, but it still needs a human to check whether a theme is real or a coincidence. No platform short of a person will catch every nuance in a heated focus group debate. You should also expect a learning curve while you connect your data and tune how the tool categorizes responses. It's built for teams that want a head start. It won't replace a seasoned researcher.
Getting Started
- Sign up on the BTInsights website and create a workspace for your project or team.
- Upload your source material, such as interview recordings, focus group videos, or survey response files.
- Let the platform transcribe the audio and generate an initial set of codes and themes from the data.
- Review and adjust the themes, then run cross-tabs to compare answers across different respondent groups.
- Export your findings as charts or slides, or share the workspace with your team.
Product Information
A quick look at BTInsights's pricing, supported platforms, and performance.
Best for
The users, tasks, and scenarios where this tool fits best.
Users
- Market researchers
- Product and UX teams
- Brand and campaign strategists
Tasks
- Coding interview transcripts
- Building survey cross-tabs
- Generating presentation slides
Scenarios
- Clearing a backlog of recorded interviews before a product decision deadline.
- Running a focus group study and needing themes the same week, not the next quarter.
- Prepping a client deliverable where survey data and qualitative quotes both need to land in one deck.
Key features
Automated Transcription and Coding
The first job of any qualitative research tool is turning audio into text you can work with. BTInsights transcribes interview and focus group recordings, then runs its own coding pass to tag responses by theme. That's the tedious part of research. It's also where the platform saves the most time. You still review the codes, but you start from a draft instead of a blank screen.
Survey Cross-Tabs
Surveys generate their own headache: cutting the data by segment to see who answered what, and then rebuilding that view every time a stakeholder asks for one more cut or a different grouping. BTInsights builds cross-tabs from your survey responses automatically, so you can compare groups without living in a spreadsheet. That saves real hours. For teams that run frequent surveys, it removes a repetitive chore and keeps the analysis consistent from study to study.
Insight Generation From Raw Data
Beyond tagging, the platform pulls themes and patterns out of your material and presents them as findings, which is the step that usually stalls when a team is drowning in raw transcripts and can't see the shape of the data yet. The point is to surface the story hiding in the data. That could be a recurring complaint across your focus group coding, or a swing in survey sentiment between two quarters. It gives you a starting point for interpretation. You decide what holds up.
Slide Generation
BTInsights generates slides from your analysis, which matters if your output is a deck for a client or an internal team. Instead of exporting numbers and rebuilding charts by hand, you get presentation material built from the coded data. The deck comes out already anchored to your themes. It shortens the gap between "we have results" and "we can present them."
One Platform for Interviews and Surveys
Many research stacks force you to juggle a transcription tool, a coding tool, and a survey package, and each handoff between them is another chance to lose data or duplicate a step you already did. BTInsights folds interviews, focus groups, and survey analysis into a single web platform. That means one place to store your data and one workflow. Less switching. Fewer exports. For a small research team, that adds up fast.
Pros and cons
Pros
- Covers transcription, coding, cross-tabs, and slides in one web platform, so you don't stitch together separate tools.
- Targets the slowest part of qualitative research, which is coding transcripts by hand.
- Handles both interview data and survey data, which suits mixed-method studies.
- Turns analysis into slide-ready output, cutting the time from data to presentation.
- Web-based, so the team can work from any machine without installing software.
Cons
- No free tier, so you can't test it on a small project before committing budget.
- AI coding needs human review, and it can misread sarcasm, hedging, or ambiguous answers in a transcript.
- Pricing isn't published on the site, which makes budgeting awkward until you request a quote.
- Output quality depends on clean source audio and well-formed survey data, so messy inputs need cleanup first.
Frequently asked questions
BTInsights is used to automate interview and survey analysis. You feed it recordings or survey data, and it transcribes, codes, and surfaces themes, then produces cross-tabs and slides. What does that look like in practice? It's built for research teams that want to cut the manual work out of qualitative and quantitative studies.
Related content
Explore related tools, skills, and articles for BTInsights.
BTInsights Alternatives
Liveplan
Palo Alto Software · BusinessLivePlan is business plan software that helps founders and small business owners turn an idea into a funder-ready plan. It combines AI-assisted writing, market research with cited sources, and connected financial forecasting so your income statement, cash flow, and balance sheet move together when you change one number. Over 1.5 million businesses have used it to plan, forecast, and track performance against real accounting data. That's a lot of founders. It's also a signal the tooling survived contact with real lenders.

Swms
Swms AI · Writing · Productivity · BusinessSwms is an AI safety compliance tool that turns a plain description of a job into ready-to-use safety documents. Describe your project, trade, and known hazards, and it writes a safe work method statement, job hazard analysis, safe work procedure, RAMS, or safety data sheet in seconds. It also ships with Oscar, a chat assistant that answers workplace safety questions in any language. Teams in construction, mining, transport, and warehousing use it to cut the paperwork that usually eats into a workday.

Rows
Rows (Superhuman) · Productivity · BusinessRows is an AI spreadsheet and data analysis tool that imports live data from more than 50 sources, then lets you work with it using plain language instead of SQL queries or nested formulas. You can pull numbers out of PDFs, connect ad platforms, databases, and bank accounts, and ask the AI to build reports, merge datasets, or set up models that recalculate themselves. It runs in the browser, works like a spreadsheet, and now sits under the Superhuman umbrella.