
CalcGen AI
CalcGen AI · Image · Coding
CalcGen AI is an AI data visualization tool that turns a text prompt or an uploaded file into interactive charts, graphs, calculators, and dashboards you can share or embed.
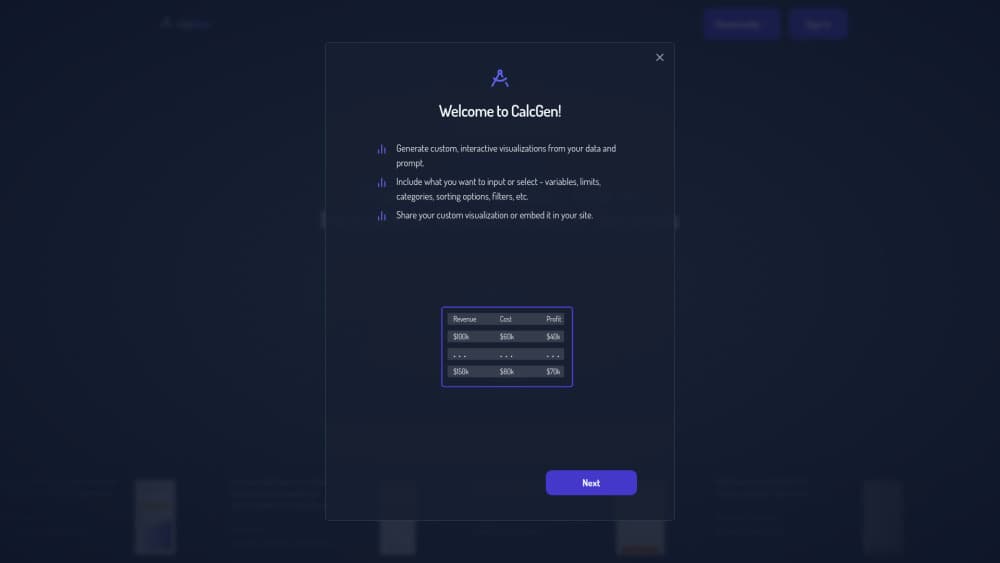
About CalcGen AI
What Is CalcGen AI
CalcGen AI is a web tool that works as an AI data visualization tool and an interactive chart maker at once. Feed it a written prompt or an uploaded dataset, and it builds interactive charts, graphs, and custom calculators. You describe what you want plotted and what you want the viewer to control, and the platform generates a working visual rather than a static image. It also runs a calculation mode, so the same interface can act as a graphing calculator AI where readers type values and watch the result change.
The people it suits are analysts, marketers, educators, and researchers who need a clear visual fast and don't want to clean a spreadsheet first. If you already have numbers, you upload a file or even a screenshot and let the tool extract the data. If you don't, the agent can research the topic on the web and build the chart with cited sources.
The limits matter as much as the strengths. It is a young product, so connections to outside databases and live data feeds are still in development, and very large or highly complex datasets can outgrow what a browsing-based tool handles well. Paid tiers exist for higher limits and more control, and several advanced integrations are not available yet.
Getting Started
- Open calcgen.ai in a browser and sign in. A free account covers the core features and a limited number of visualizations.
- Describe the chart, calculator, or dashboard you want in plain language, and name the controls you want the viewer to have, such as sorting, filters, or variables.
- Add your own data by uploading a file or a screenshot, or let the agent pull relevant figures from the web with sources attached.
- Adjust the result, then share a link or embed the visualization in a site, blog, or presentation. Upgrading to a paid plan raises the usage limits.
Product Information
A quick look at CalcGen AI's pricing, supported platforms, and performance.
Best for
The users, tasks, and scenarios where this tool fits best.
Users
- Business analysts
- Educators and tutors
- Marketers and content creators
- Students and hobbyists
Tasks
- Generating a chart from a prompt
- Building a custom graphing calculator
- Researching data from the web
- Extracting data from a file or screenshot
Scenarios
- Preparing a client report
- Publishing a data-driven article
- Teaching a math or science concept
Key features
Generate charts from a prompt
The core workflow takes a written description and returns an interactive visual. You say what to plot and what to expose, such as categories, limits, sorting, and filters, and the tool assembles the chart around those choices. The output responds to the viewer rather than sitting still, which is the main difference from a picture pasted into a slide.
Custom graphing calculators
Beyond charts, the CalcGen AI calculator builder creates interactive tools. You define the equations and the variables, and the result is a tool where readers type numbers and watch outputs update. It suits educators and anyone who needs a reusable model, such as a loan calculator or a formula explorer, without writing front-end code.
Data from files and screenshots
You don't have to format a dataset before you start. The tool accepts an uploaded data file or even a screenshot and extracts the values it needs to draw the chart. That removes the usual step of tidying a spreadsheet, and it means a figure trapped in an image can still become a working visualization.
Web research with cited sources
When you don't have the numbers, the built-in agent can look them up. Describe the topic and the tool gathers relevant figures from the web and constructs the chart, attaching the sources it drew from. For exploratory work where the data isn't in hand yet, this shortens the path from question to visual.
Sharing and embedding
Finished visualizations can be shared with a link or embedded into a website, blog, or presentation, which is how you embed interactive charts in your own pages. Because the chart stays interactive, readers can zoom, filter, and drill into segments on the page rather than viewing a frozen snapshot. This is what makes it useful for communications that expect the audience to poke around.
Customization controls
Each visual accepts a range of parameters, including variables, limits, categories, sorting options, and filters. You set these when you build the visual so the end product answers the specific question you have in mind, not just a generic rendering. It also gives viewers the levers they need to slice the data their own way.
Community gallery
A public gallery collects charts and calculators made by other users, giving you examples to borrow from rather than starting from a blank prompt. It shortens the learning curve and shows what the tool can produce before you commit time to a build.
Pros and cons
Pros
- Turns a plain-language prompt into a working interactive chart, so you skip manual chart building and code.
- Accepts uploaded files or screenshots and can also research data from the web with sources.
- Output stays interactive and can be shared or embedded in sites, blogs, and presentations.
- Free tier covers core features, which lets you test the workflow before paying.
Cons
- As a newer tool, database connections and real-time updates are still in development, so live data pipelines are not an option yet.
- Very large or highly complex datasets can exceed what a browser-based tool handles comfortably.
- Higher usage limits and extra customization sit behind paid plans, which matters if you generate visuals often.
- No public API is documented, so teams cannot wire CalcGen AI into their own products today.
Frequently asked questions
CalcGen AI builds interactive charts, graphs, calculators, and dashboards from a text prompt or an uploaded dataset. You describe what to plot and what the viewer should control, and it returns a shareable visual you can embed. It is aimed at people who need a clear data visual quickly without manual chart work.
Related content
Explore related tools, skills, and articles for CalcGen AI.
CalcGen AI Alternatives

Google EmbeddingGemma 2
Google DeepMind · Writing · Image · CodingGoogle EmbeddingGemma 2 is a 740M-parameter open model that turns text, code, images, audio, and video frames into vectors in one 768-dimension space, running on phones and laptops.

Tractionwave
TractionWave · Image · MarketingTractionWave is an AI attention heatmap tool for static ads. Upload a PNG or JPG and it returns predicted attention, ranked hotspots, and fixes before you spend budget.

Imejis.io
Imejis.io · Image · MarketingImejis.io is an AI design studio for agents and marketing teams. Describe an image in plain words, and it writes the copy, builds the layout, reflows it to every size, then exports a finished file.