

Chartbuilder
Chartbuilder · Image · Productivity
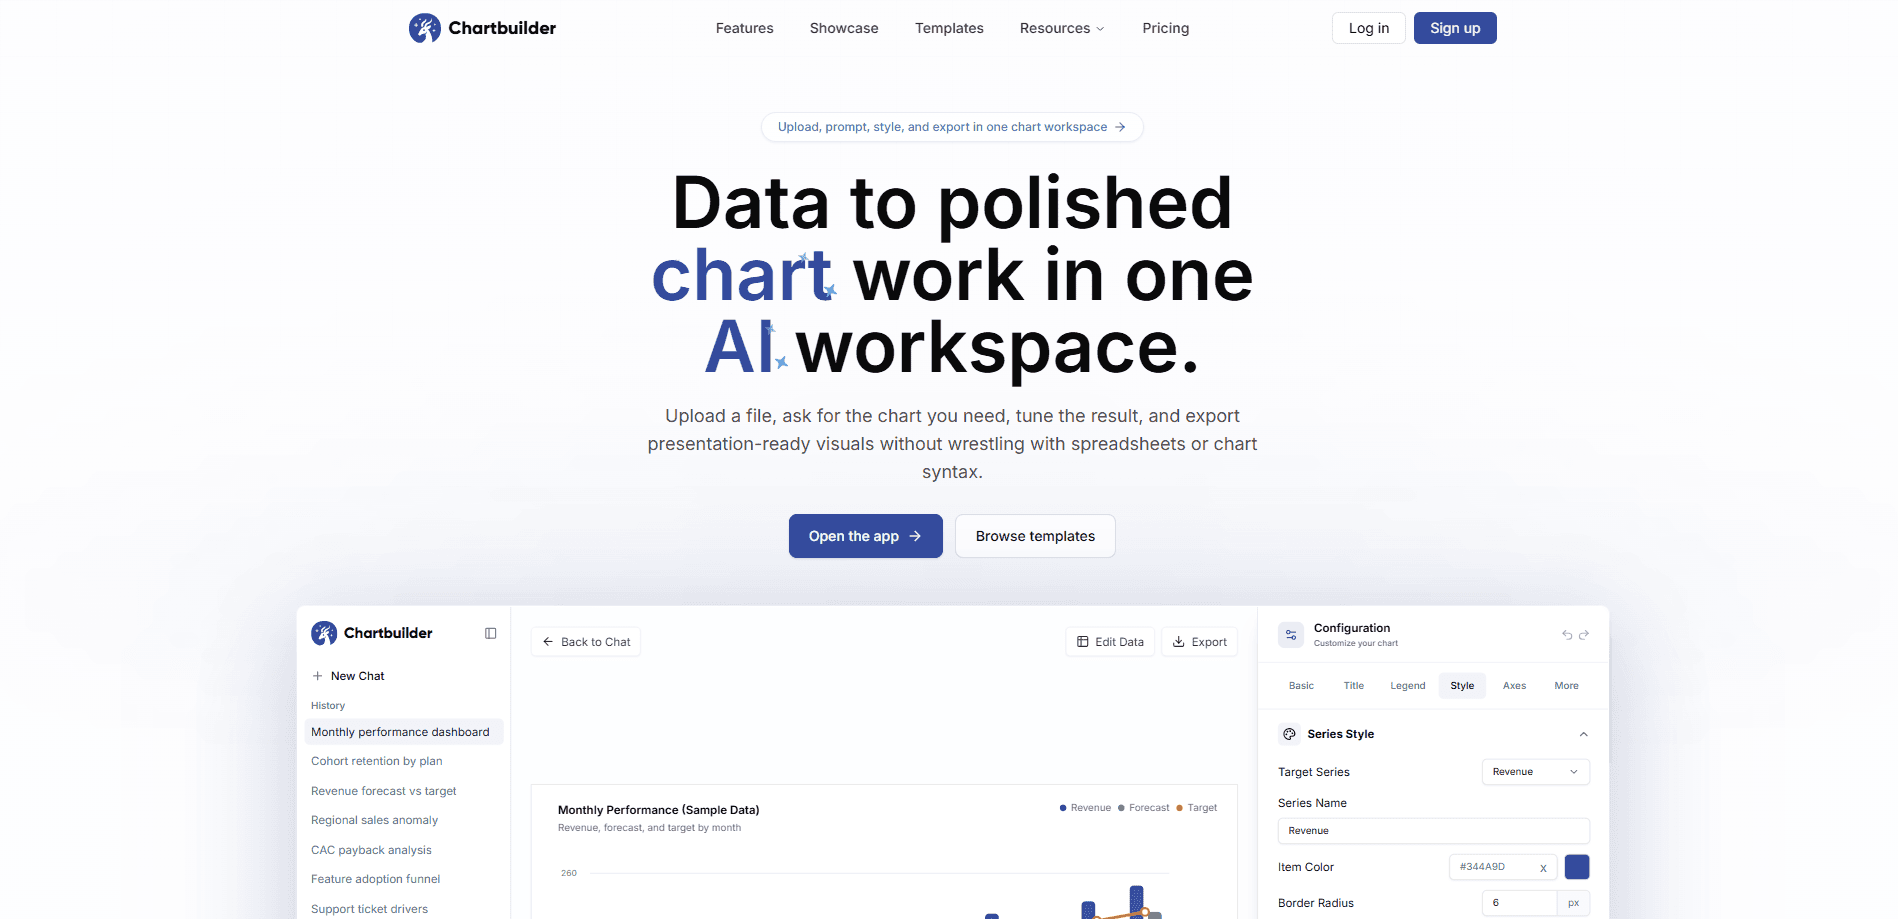
Chartbuilder is an AI chart workspace that turns uploaded data into polished, presentation-ready charts in seconds. You upload a CSV or Excel file, describe the chart you want in plain language, then review and refine the result before exporting it as PNG or SVG. It's built for people who need clear charts for reports and presentations without opening a spreadsheet formula or writing code.
About Chartbuilder
What Is Chartbuilder
Chartbuilder is a web-based AI chart tool built around one simple loop: upload data, describe the chart you want, edit the result, and export it. Instead of dragging fields into a chart builder by hand, you type something like "show monthly revenue as a bar chart" and the tool produces a first draft you can inspect and change.
Think of it as a data visualization tool that starts from your file, not from a blank canvas. That one shift is the whole product.
The product exists because making a chart usually takes longer than it should. The team behind it argues that the repetitive setup work, choosing axes, sizing, labels, ordering, eats time you'd rather spend deciding what the data should say. Chartbuilder handles that first draft so you can move on to judgment calls.
That pitch holds up. The output is a real chart, not a mockup.
Where it stands apart is the editing stance. The output stays editable and inspectable rather than locked into a finished image. You're meant to treat the AI result as a starting point you still own, which matters if the chart is going in front of a client or a manager. The trade-off is scope: this is a focused chart maker for business reporting and presentation visuals, not a general data-analysis platform, so don't expect statistical modeling or dashboard hosting.
Getting Started
- Create a free account at chartbuilder.org. No credit card is needed to start, and the free tier includes 3 chart-generation messages.
- Upload your dataset, a CSV or Excel file, straight from your computer.
- Describe the chart you want in plain language, or browse the template library if you'd rather start from a known style.
- Review the generated chart and refine it, adjusting data, labels, styling, and brand colors until it reads the way you need.
- Export the finished chart as PNG for slides and documents, or as SVG when you need a vector that stays sharp at any size.
Product Information
A quick look at Chartbuilder's pricing, supported platforms, and performance.
Best for
The users, tasks, and scenarios where this tool fits best.
Users
- Business analysts
- Consultants and freelancers
- Marketers and content creators
- Students and educators
Tasks
- Converting CSV data into a chart
- Turning Excel sheets into presentation visuals
- Matching brand colors
- Exporting vector charts
Scenarios
- Weekly reporting
- Last-minute deck prep
- Early project research
- One-off client deliverables
Key features
Plain-Language Chart Generation
You describe the chart you want in ordinary words, and Chartbuilder builds a first draft from your uploaded data. That removes the usual step of choosing a chart type, then mapping columns to axes by hand. For anyone who knows what the chart should show but not how to configure it, this is the core shortcut.
Editable AI Output
The generated chart isn't a frozen image. You can open it up, check the underlying data, and change what's wrong before you export. This matters when a client or a manager will scrutinize the numbers, because you can catch a bad grouping or a mislabeled axis while it's still fixable. That's the difference between a chart maker for reports and a chart screenshot.
CSV and Excel Upload
The tool works from the formats most people already have, CSV and Excel files. There's no need to reshape your data into a special schema first. If your numbers live in a spreadsheet export, you can generally upload them as-is and start prompting. No cleanup step.
Brand Color and Styling Control
You can restyle charts with your own colors rather than living with a default palette. For teams that publish recurring reports, that consistency is the difference between a chart that blends in and one that looks bolted on. Styling changes apply to the chart itself, not just a frame around it. Small detail. Big effect on a finished report.
PNG and SVG Export
Charts export as PNG for slides, documents, and social posts, or as SVG when you need a vector that stays sharp at any size. SVG is the useful one for print and large displays, where a raster screenshot would blur. Both formats cover the two most common places a chart ends up.
Template Library
A set of chart templates gives you a starting point when you'd rather not prompt from scratch. Templates help when you want a familiar layout or a specific business-report look. They also cut down on trial and error if you're new to describing charts in words.
Pros and cons
Pros
- Turns CSV and Excel files into charts without manual field mapping.
- Free tier with 3 chart-generation messages and no credit card required.
- Paid credits don't expire, so you can buy once and use them later.
- Output stays editable, so you can fix the AI's first draft before exporting.
- Exports both PNG and SVG, covering slides, print, and web.
- Doubles as a CSV chart tool and Excel to chart converter from one upload.
- Brand-color styling keeps charts consistent across a report.
Cons
- Focused on charting, so it won't replace a full analytics or BI dashboard.
- Free tier is small at 3 messages, meaning heavier use needs paid credits.
- No confirmed public API, which rules out automated or programmatic chart generation for now.
- Web-only, so there's no desktop or mobile app for offline work.
Frequently asked questions
Chartbuilder is an AI chart maker for turning uploaded CSV and Excel data into finished charts. You use it to build presentation-ready visuals for reports, decks, and content without manual chart setup.
Related content
Explore related tools, skills, and articles for Chartbuilder.
Chartbuilder Alternatives

Google EmbeddingGemma 2
Google DeepMind · Writing · Image · CodingGoogle EmbeddingGemma 2 is a 740M-parameter open model that turns text, code, images, audio, and video frames into vectors in one 768-dimension space, running on phones and laptops.

Tractionwave
TractionWave · Image · MarketingTractionWave is an AI attention heatmap tool for static ads. Upload a PNG or JPG and it returns predicted attention, ranked hotspots, and fixes before you spend budget.

Imejis.io
Imejis.io · Image · MarketingImejis.io is an AI design studio for agents and marketing teams. Describe an image in plain words, and it writes the copy, builds the layout, reflows it to every size, then exports a finished file.