

Charts Not Chapters
Charts Not Chapters · Image · Productivity
Charts Not Chapters is an AI infographic generator that turns text, spreadsheets and documents into editable visual charts you can export and keep working on.
About Charts Not Chapters
What Is Charts Not Chapters
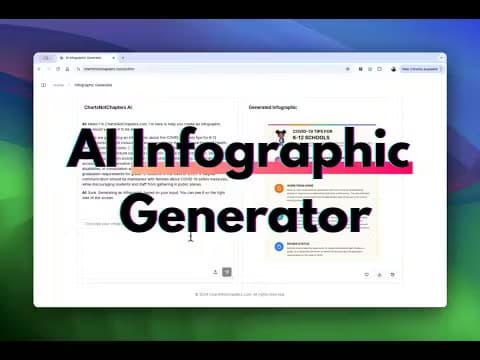
Charts Not Chapters is a web-based AI infographic generator built around one idea: most people skim visuals, not walls of text. You feed it text, a CSV file, a PDF, an image, a website or a YouTube link, and it builds an infographic from scratch instead of dropping your content into a ready-made template.
The tool picks a format for you based on what the data needs. A short list of tips becomes a list layout, a set of numbers becomes a bar or pie chart, and a process becomes a flowchart. From there you chat with the AI to change colors, fonts and layout, or upload a reference image and pull its theme colors.
The catch is control versus speed. Full generation gives you something to react to in seconds, but polish still takes back-and-forth, and the free-and-cheap tiers cap how many builds you get each month.
Getting Started
- Sign up for an account at chartsnotchapters.com and pick a plan.
- Paste your text or upload a source file such as a CSV, Excel sheet, PDF or image.
- Let the AI select a format, then review the infographic it generates.
- Chat with the AI to adjust colors, fonts and layout, or upload an image to match its theme colors.
- Export the result as EPS, PDF or HTML and keep editing or publish it.
Product Information
A quick look at Charts Not Chapters's pricing, supported platforms, and performance.
Best for
The users, tasks, and scenarios where this tool fits best.
Users
- Marketers and content teams
- Founders and consultants
- Students and teachers
Tasks
- Infographic generator from text
- CSV to infographic conversion
- Editing an existing graphic
Scenarios
- Turning a report into a one-page summary
- Building social and marketing visuals
- Automating repeat graphics
- Repurposing a video or article
Key features
Chat to generate and refine
You generate an infographic by describing what you want, then keep the conversation going to change anything. The real-time chat adjusts format, colors, fonts and details, so you shape the result without touching a design tool. That back-and-forth is the core way to work in the product.
Smart format selection
The AI reads your content and chooses a layout that fits it, turning text to infographic input into a list, a comparison, a flowchart, a pie chart or a bar chart. You get a sensible starting format instead of an empty canvas. As an AI chart maker, it takes the guesswork out of picking the right chart for a given set of data, and the result doubles as AI data visualization you would otherwise build by hand.
Not template based
Every infographic is generated from scratch rather than filled into a fixed template, which is the main thing that separates it from classic infographic makers. You edit through prompts instead of dragging blocks around a locked design. The trade-off is you may need a follow-up prompt to nudge it toward the exact look you want.
Editable exports
You can export to EPS, PDF or HTML and keep refining in the tools you already use, such as Adobe Illustrator or Photoshop. The HTML option hands you something web-ready. This matters because AI output is a starting point, not a finished asset.
Flexible data import
The tool ingests spreadsheets, PDFs, images, websites and YouTube videos, so you rarely reformat your source first. You can also upload an image just to extract its theme colors and match a brand. That range means fewer steps before you actually generate anything.
Controllable design and custom illustrations
You set the size, color theme and other details directly, and the AI adds custom illustrations and visual elements that fit the data. The control panel keeps the output close to your intent rather than a random generated style. It helps non-designers get something that looks intentional.
Pros and cons
Pros
- Generates from scratch instead of a template, so two infographics on the same topic don't look identical.
- Auto format selection picks a chart type that fits the content, which saves beginners from choosing wrong.
- Editable exports to EPS, PDF and HTML mean the output drops into existing design and web workflows.
- Handles many input types, including CSV, Excel, PDF, images, websites and YouTube links.
- Enterprise plan adds an API plus Make and Zapier integrations for automated generation.
Cons
- No free plan, so you have to pay before you can try it, and the entry plan caps you at 10 generations a month.
- Getting a polished result usually takes a few chat rounds, and prompt-driven editing can be slower than dragging elements by hand.
- The tool is web-only, so there's no dedicated mobile app for quick edits on the go.
- Pricing is not published on the site at a fixed rate, so you have to check the current plan cost before committing.
Frequently asked questions
Charts Not Chapters turns text, spreadsheets and documents into infographics. You use it to convert a report, a set of numbers or a process into a visual that is faster to scan than the original text.
Related content
Explore related tools, skills, and articles for Charts Not Chapters.
Charts Not Chapters Alternatives

Google EmbeddingGemma 2
Google DeepMind · Writing · Image · CodingGoogle EmbeddingGemma 2 is a 740M-parameter open model that turns text, code, images, audio, and video frames into vectors in one 768-dimension space, running on phones and laptops.

Tractionwave
TractionWave · Image · MarketingTractionWave is an AI attention heatmap tool for static ads. Upload a PNG or JPG and it returns predicted attention, ranked hotspots, and fixes before you spend budget.

Imejis.io
Imejis.io · Image · MarketingImejis.io is an AI design studio for agents and marketing teams. Describe an image in plain words, and it writes the copy, builds the layout, reflows it to every size, then exports a finished file.