
Datastory
Datastory · Productivity · Business
Datastory is a data storytelling platform that turns spreadsheets and open datasets into interactive charts, AI-written captions and embeddable pages, without code.
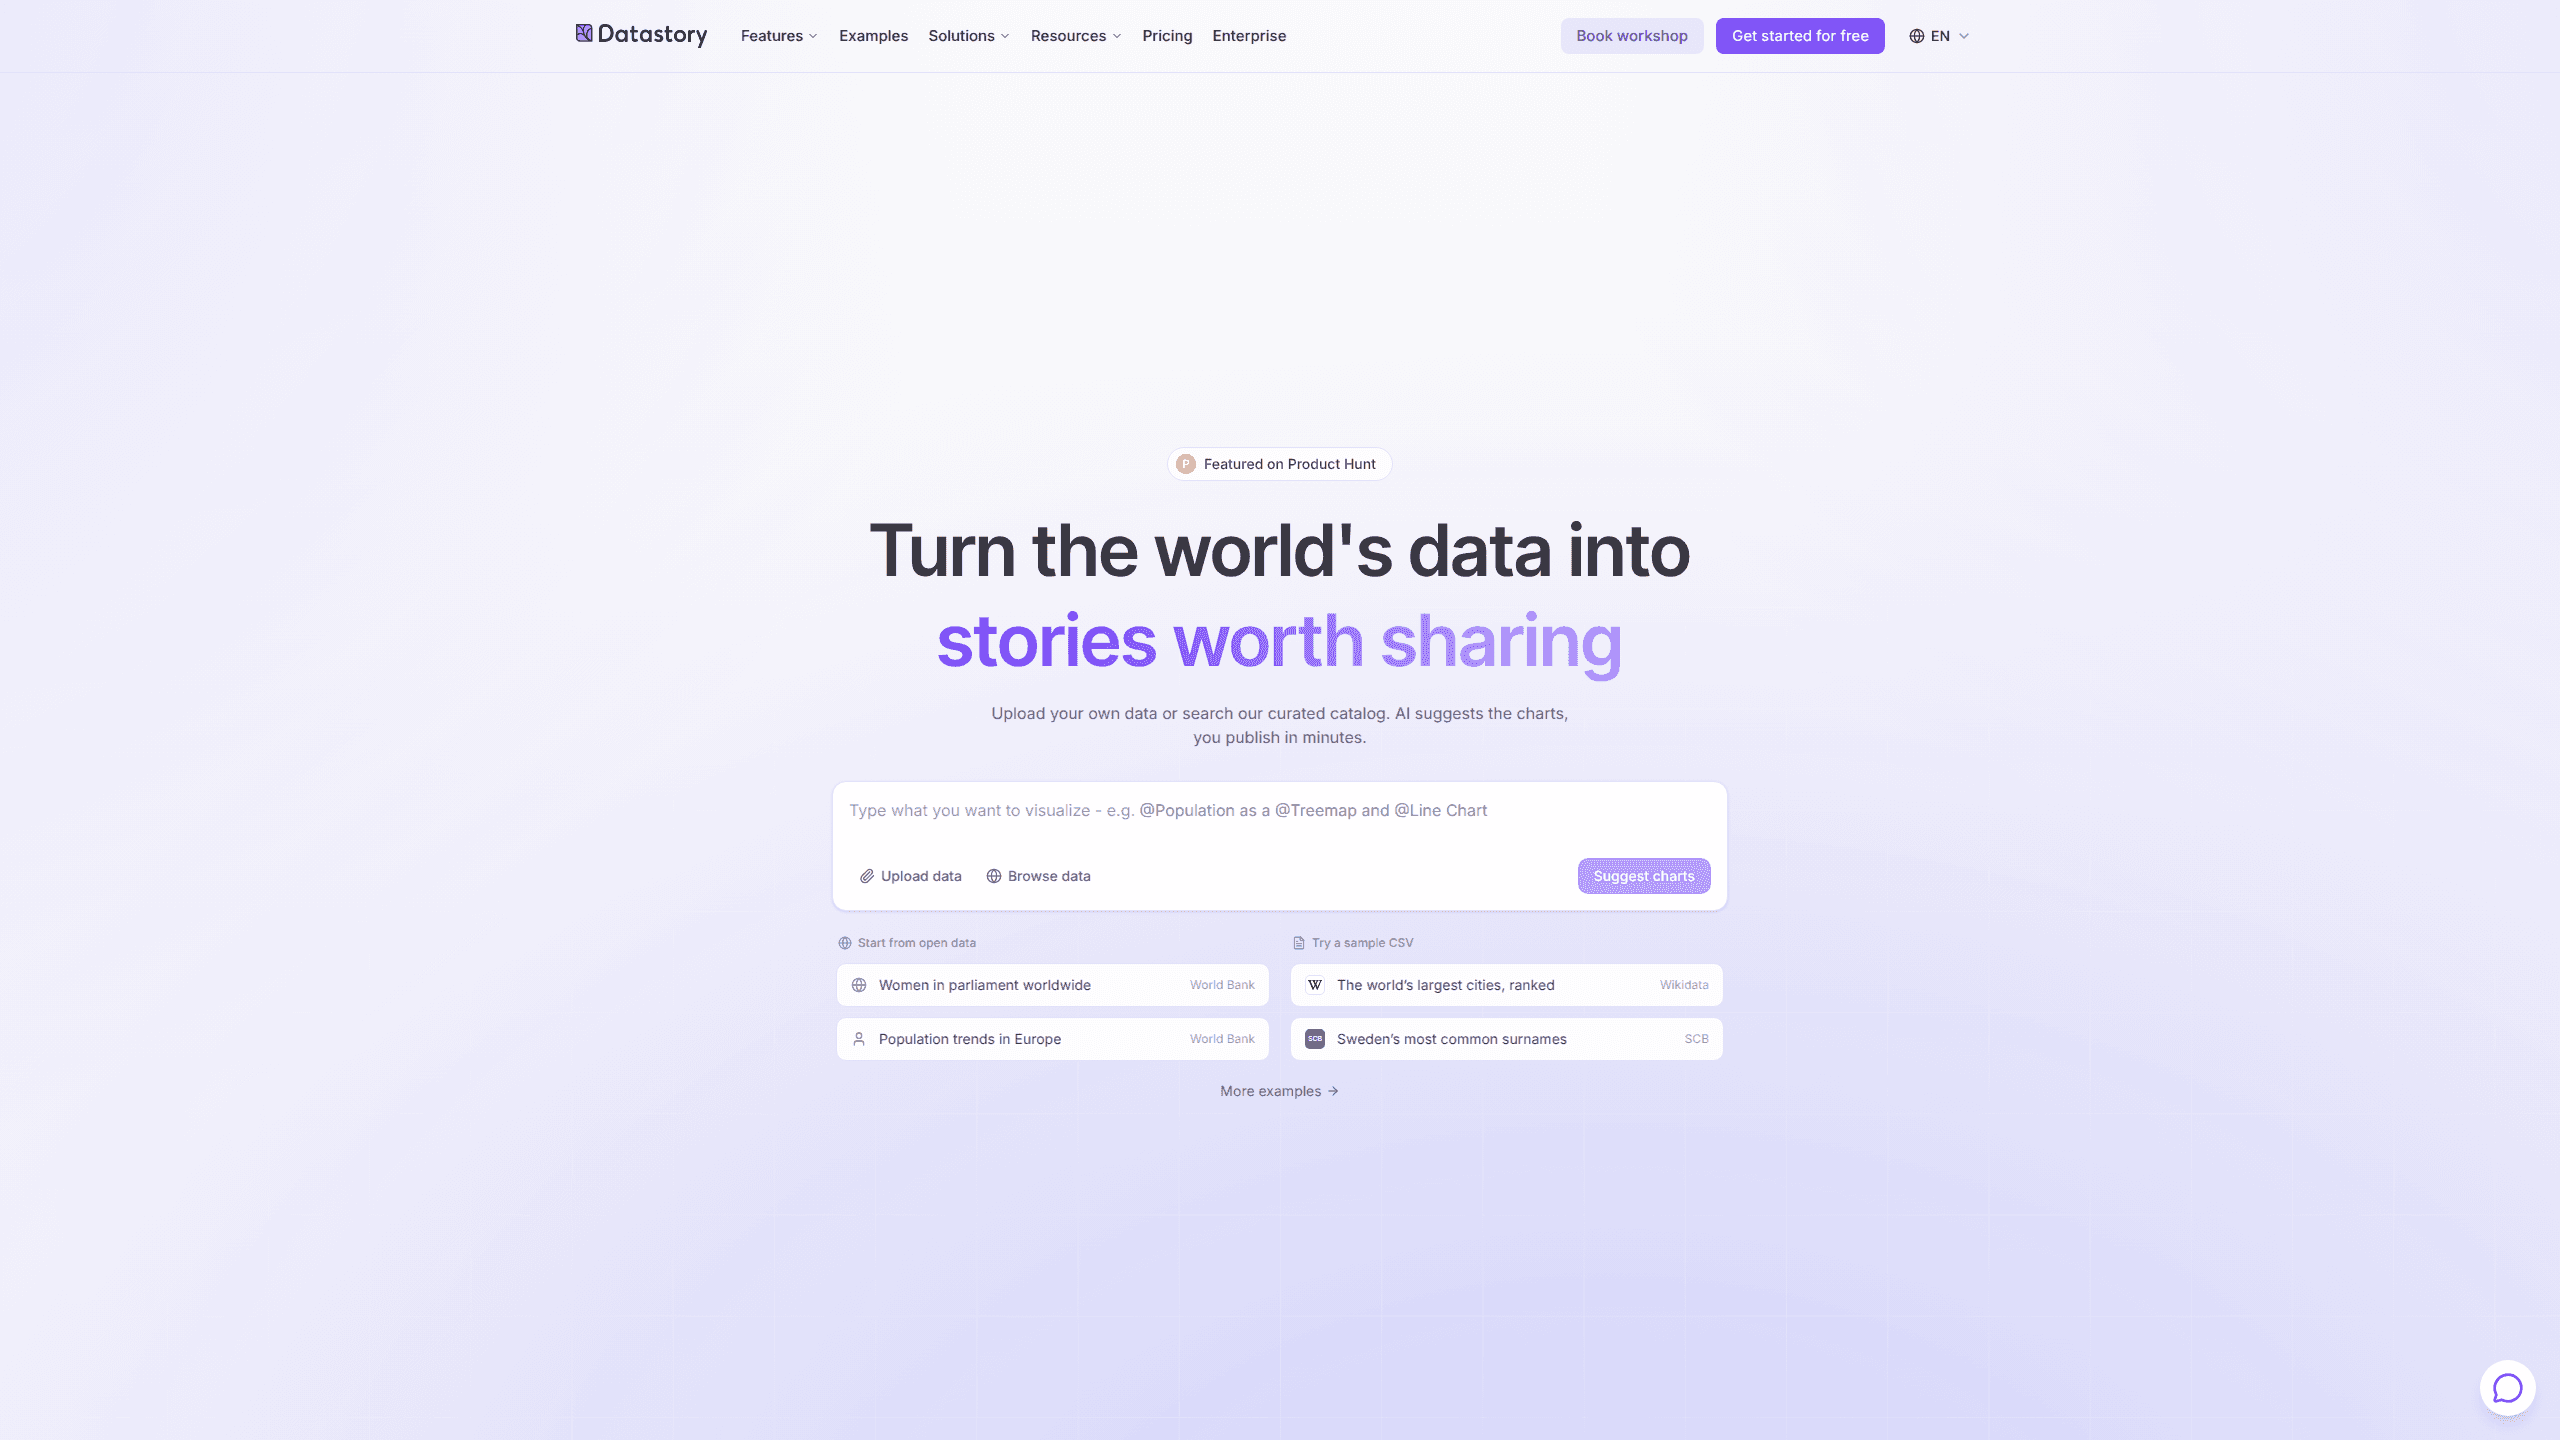
About Datastory
What Is Datastory
Datastory is a Swedish platform for people who publish data rather than analyze it privately. You bring a CSV, a linked dataset, or a table from the open data catalog, and the editor returns a responsive chart you can annotate, brand, and embed on a site or in a newsletter. The company has run data communication projects since 2013, and its non-profit arm, datastory.org, works with schools and public education sites.
The product is a data visualization tool that assumes the output will be read outside your team. There's no dashboard to build first and no SQL to write. Charts are the unit of work, AI data analysis runs on the same tables, and an insight arrives with the row it came from. That matters when the output goes in front of readers who will check the number.
The limits are mostly about scope. Datastory publishes stories; it doesn't replace an internal metrics dashboard or a data warehouse. The free plan stops at ten visualizations and three collaborators. Linked data, custom integrations, and white label sit in Enterprise, and there's no public API to pull charts into another system. The whole product runs in a browser, and the workflow is built to publish data stories rather than to watch live metrics.
Getting Started
- Create an account at platform.datastory.tech. The Starter plan needs no card.
- Add data. Upload a CSV or Excel file, connect a dataset, or search the open data catalog by topic, source, or country.
- Pick a chart. The picker reads your columns and proposes encodings for categorical, time, geographic, or hierarchical data. You can switch chart types later without rebinding the data.
- Refine the output. Add a headline, annotations, a source line, and methodology notes, then apply a brand preset or an editorial template.
- Publish. Copy the embed link into Notion, Webflow, your CMS, or a newsletter, or share the hosted page.
Product Information
A quick look at Datastory's pricing, supported platforms, and performance.
Best for
The users, tasks, and scenarios where this tool fits best.
Users
- Data journalists
- Researchers at institutes and universities
- Communications teams in public organizations
- Analysts who present to non-specialists
Tasks
- Publishing a chart with an article
- Explaining a national statistic to a general audience
- Comparing regions over time
- Turning a messy internal CSV into a shareable page
Scenarios
- A newsroom on deadline
- An annual report or statistics release
- A campaign page that needs evidence
Key features
A chart gallery that survives a type change
Bars, lines, areas, beeswarms, slopes, treemaps, and scatter plots all live in one picker. Switching from a bar chart to a slope chart keeps the data binding, which saves the rebuild that usually follows a design change. Every chart is responsive by default, so the same embed works on a phone and on a desktop.
Chart suggestions based on your columns
The picker inspects the shape of your table and proposes an encoding: categorical, temporal, geographic, or hierarchical. You see why a chart fits before you commit, and you can override the suggestion. This is the part that helps people who know their data but not the grammar of charts.
AI answers with the row attached
Ask a question in plain English and the AI replies against the tables in your workspace, with citations to the rows and a matching chart. The insight finder scans numeric columns for spikes, regime changes, and cross-table correlations. When no source supports a claim, the assistant says so instead of filling the gap.
Compose a story from one prompt
A single sentence such as "visualize Swedish housing prices by region since 2010" returns an outline, chart types, and draft captions. You edit the result, swap a chart, or rewrite the headline. The AI proposes, and the published version stays under your control.
An open data catalog with named sources
The catalog indexes datasets from the OECD, the WHO, Eurostat, and other vetted publishers. You can browse by topic, by source, or by what's trending, and filter to the country you need. Data downloads are unlimited on every plan, including the free one.
Linked data and reusable metrics
On Enterprise, datasets join into a knowledge graph where a metric is defined once and reused across stories, dashboards, and embeds. Definitions are versioned, documented, and updated everywhere at once. Semantic types handle dates, locations, and relationships, which removes the lookup formulas that usually glue files together.
Embeds and brand presets
You embed charts as a responsive iframe with a shareable URL and an Open Graph preview, so a link unfurls properly in Slack or LinkedIn. Custom logos and theming are part of Professional, and white label is available on Enterprise. Editorial templates cover the common layouts so you're not starting from an empty canvas.
Pros and cons
Pros
- The free plan includes the full chart gallery, the open data catalog, and 100 AI credits per month.
- Charts stay editable after publishing, and a type change doesn't break the data binding.
- AI output cites specific rows, which makes fact-checking a chart far quicker.
- Shared metric definitions keep a team from publishing two different numbers for the same thing.
- Embeds work in Notion, Webflow, newsletters, and most CMS platforms without developer time.
Cons
- Ten visualizations and three collaborators on the free plan run out fast for a newsroom or a comms team.
- Linked data, data integration, and white label require an Enterprise contract, so smaller teams can't use the knowledge graph.
- AI credits are metered separately at 100 or 1,000 per month, and heavy analysis work hits the ceiling before the month ends.
- It's browser only with no public API, so automated publishing means exporting and uploading again.
Frequently asked questions
Yes. The Starter plan costs $0 and includes ten data visualizations, three collaborators, unlimited downloads from the open data catalog, and 100 AI credits per month. No card is needed to start.
Related content
Explore related tools, skills, and articles for Datastory.
Datastory Alternatives

Base Code
Base44 (Wix) · Coding · ProductivityBase Code is a shared cloud development environment from Base44. Teammates describe changes to an existing GitHub codebase in chat, preview them live and send them back as pull requests.

Knocket
Knocket (Tencent RTC team) · Productivity · Business · ChatbotKnocket is a free live chat and contact page tool that lets visitors message you from your website, app, or a shareable link, with every reply handled from Telegram or one inbox.

FloorGen
Vinit Kumar (FloorGen) · Productivity · China AIFloorGen is a browser-based floor plan maker that turns a sentence or a sketch into an editable 2D plan and a 3D walkthrough. Export to PDF, DXF or video, and draw without an account.