

EOS Data Analytics
EOS Data Analytics (EOSDA) · Image · Marketing
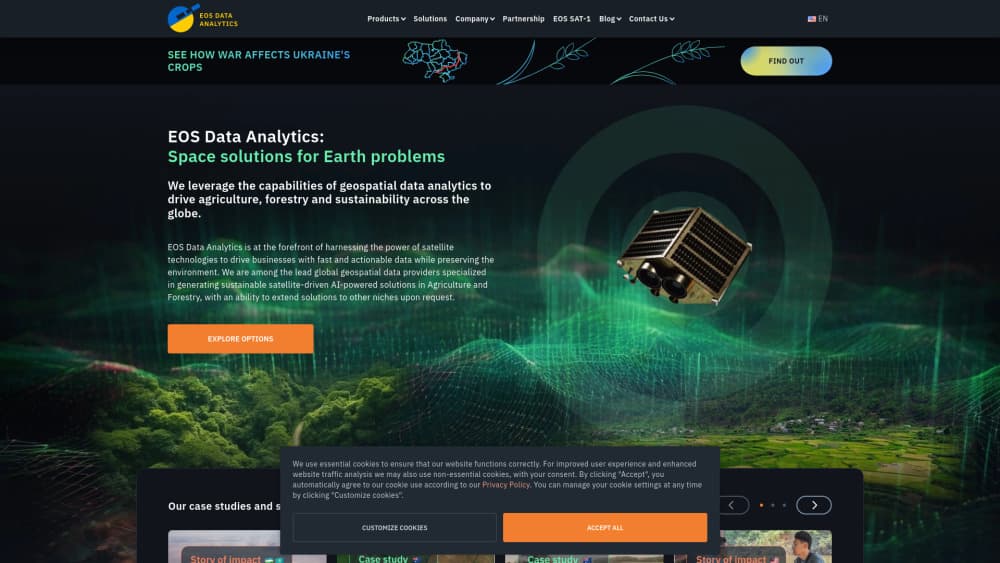
EOS Data Analytics (EOSDA) turns satellite imagery into crop health maps, risk alerts and field reports, and its LandViewer tool opens decades of Earth observation data to anyone with a browser.
About EOS Data Analytics
What Is EOS Data Analytics
EOS Data Analytics is a satellite data analytics company that sells software on top of imagery. It was founded in 2015, flies its own EOS SAT-1 satellite and also buys scenes from more than 20 partner constellations. Two products carry most of the business: EOSDA Crop Monitoring for farms and LandViewer for general imagery work.
The idea behind it is simple. You don't buy pixels, you buy answers. Which corner of field 12 is losing vigor, when did the canopy thin out, where should the spreader run lighter. Vegetation indices do the measuring and the platform puts them on a map with a chart beside it.
Some limits matter before you sign up. Readings depend on how fresh the image is, so cloud cover and revisit gaps can leave a field blank for a week. High-resolution scenes cost extra. Per-hectare pricing comes as a quote, not a public price tag.
Getting Started
- Create an account at crop-monitoring.eos.com and activate the Gift field, which covers up to 300 ha.
- Add fields by drawing boundaries or uploading a boundary file, then set crop type, sowing date and season.
- Open a field card to read vegetation indices, growth stages, weather history and the risk map.
- Send scouting tasks from the mobile app, or export a VRA map and a report for the team.
Product Information
A quick look at EOS Data Analytics's pricing, supported platforms, and performance.
Best for
The users, tasks, and scenarios where this tool fits best.
Users
- Row-crop farmers and farm managers
- Agronomists and crop consultants
- Analysts, insurers and foresters
Tasks
- Tracking crop health monitoring through the growing season
- Planning variable-rate application
- Verifying damage for claims and audits
- Embedding satellite data in your own product
Scenarios
- Hunting problems mid-season on a large holding
- A wet spring with few clear scenes
- Land and forestry checks outside farming
Key features
Crop Health Monitoring With Vegetation Indices
Ten ready-made indices, including NDVI, NDMI, MSAVI and RECI, sit on top of cloud-cleared Sentinel-2 scenes at 10 m. You can order PlanetScope at 3 m or EOS SAT-1 at 1.5 m when a field needs a closer look. Each field card pairs the index map with a chart, so you read the trend instead of a single day.
Risk Map And Change Alerts
The risk map scores disease pressure, weather stress and index swings across all your fields and flags the ones that moved. Email alerts fire when a new scene lands over an area of interest or when an index crosses a threshold. The practical effect: you spend scouting hours where something actually changed.
Variable Rate Application Maps
VRA maps take an index, elevation or machine data layer and split a field into zones with different application rates. Export the file to a controller and the spreader cuts fertilizer, seed or lime where the zone doesn't need it. Farms with uneven soils usually see the fastest payback here.
LandViewer Imagery Search
LandViewer is a browser based satellite imagery platform: search by coordinates, preview the scene, then apply more than 20 indices and band presets. Change detection, time series charts and time-lapse exports sit in the same window. Downloads come as GeoTIFF, KMZ or JPEG, and WMS sharing keeps large files off your drive.
EOSDA API Connect
The REST API hands imagery, custom band combinations, elevation, radar and weather data to your own application or GIS. Requests are counted monthly and billed annually, with a free trial available after you register. It suits teams that want EOSDA's processing without the dashboard.
Field Activity Log And Scouting App
Every tillage pass, irrigation run and scouting note lands in one log tied to the field, and the team can plan tasks and track completion from the same screen. The iOS and Android app is built mainly for scouts in the field, so it ships with a narrower feature set than the web version.
Pros and cons
Pros
- The Gift field covers up to 300 ha with Professional plan tools, so a first season costs nothing.
- Three imagery sources at different resolutions, including EOSDA's own EOS SAT-1 at 1.5 m.
- Indices and band presets are prebuilt, which means you can read a field without remote sensing training.
- The REST API and WMS sharing push data into tools your team already runs.
- Annual billing halves the cost against monthly payments.
Cons
- High-resolution archive images are billed per order and stay outside every subscription, so a 0.3 to 2 m request can blow a small budget.
- Prices are quote-based per hectare, which makes comparing plans a sales call rather than a page visit.
- The free tier covers a single field, so testing across a real farm needs a paid plan early.
- Dense layers such as zoning, VRA and index stacks assume some agronomy background, and a first-time user can drown in options.
Frequently asked questions
It turns satellite imagery into farm and land decisions: crop health maps, risk alerts, variable-rate maps, damage checks and imagery archives. Agriculture is the core, with forestry, insurance and infrastructure work handled through LandViewer and custom reports.
Related content
Explore related tools, skills, and articles for EOS Data Analytics.
EOS Data Analytics Alternatives

Google EmbeddingGemma 2
Google DeepMind · Writing · Image · CodingGoogle EmbeddingGemma 2 is a 740M-parameter open model that turns text, code, images, audio, and video frames into vectors in one 768-dimension space, running on phones and laptops.

Tractionwave
TractionWave · Image · MarketingTractionWave is an AI attention heatmap tool for static ads. Upload a PNG or JPG and it returns predicted attention, ranked hotspots, and fixes before you spend budget.

Imejis.io
Imejis.io · Image · MarketingImejis.io is an AI design studio for agents and marketing teams. Describe an image in plain words, and it writes the copy, builds the layout, reflows it to every size, then exports a finished file.