

GraphicInfo
GraphicInfo · Image
GraphicInfo is an AI infographic generator and online infographic maker. It turns a prompt into an editable visual for marketers, teachers, and creators.
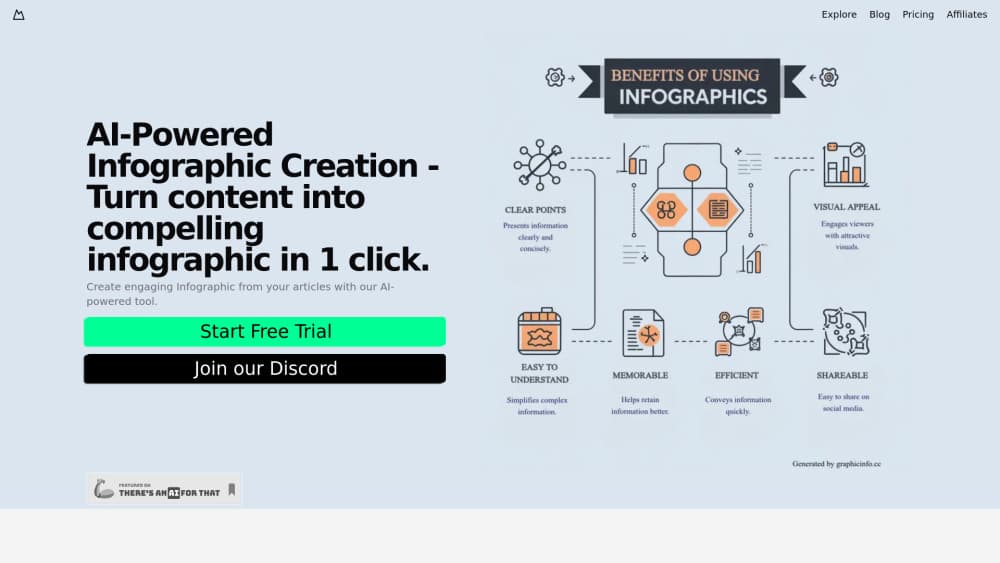
About GraphicInfo
What Is GraphicInfo
GraphicInfo is an online infographic maker that turns a written brief into a finished design. You describe the topic, paste the key facts, pick an aspect ratio, and the AI agent builds a complete HTML infographic with a structured visual story. From there you refine it by chat or by dragging elements around the canvas.
The appeal is the split between speed and control. AI handles the first pass, so you don't start from a blank page. Nothing is locked. Text, fonts, colors, size, position, and layer order are all editable directly on the canvas, which gives you more freedom than most template-based infographic generators allow.
The clearest limits are that it's browser-only and credit-based. There's no desktop app. There's no mobile app. Heavy users also burn through credits fast, because every single generation and every revision draws from the exact same shared credit pool.
Getting Started
- Create a free account on graphicinfo.cc, which starts you with 20,000 lifetime credits.
- Enter a topic or paste the key facts, then choose an aspect ratio for the layout.
- Attach any references, such as images or text, and mention them in your prompt so the result reflects your source material.
- Let the AI agent build the infographic, then request changes by chat.
- Select elements on the canvas to adjust text, colors, and layout, then export as PNG, JPEG, or WebP.
Product Information
A quick look at GraphicInfo's pricing, supported platforms, and performance.
Best for
The users, tasks, and scenarios where this tool fits best.
Users
- Marketers
- Teachers and trainers
- Content creators
- Small teams without a design tool budget
Tasks
- Prompt to infographic
- Turning raw data into a visual story
- Post-processing a generated design
- Multilingual or template-free visuals
Scenarios
- Weekly report summaries
- Launch and campaign handouts
- Classroom or workshop material
- Explaining a process to a non-technical audience
Key features
Prompt-to-Infographic AI
You describe your topic, audience, and visual direction, and the agent creates a complete HTML infographic on its own. It works from a brief rather than a fixed template, so the layout follows your content instead of forcing your content into a preset. This is the part that saves the most time. You skip the blank-canvas stage entirely.
Chat-Based Revisions
Once a draft exists, you keep the conversation going. Ask the agent to rewrite a section, restyle the whole design, reorganize the structure, or add visuals, and it updates the existing infographic rather than starting over. That matters when you're iterating on wording and don't want to lose a layout you already like.
Editable Visual Canvas
The canvas is where GraphicInfo separates itself from generator-only tools. You can select any element and change its text, font, color, size, position, or layer order directly. For anyone who's been stuck with a design they can't fix, this direct control is the difference between usable and frustrating.
Reference-Aware Design
You can upload images or text references and mention them in your prompt, so the result reflects your source material. That's useful when branding, product shots, or a specific document need to carry into the final visual rather than being paraphrased away.
Multiple Export Formats
Finished designs export as PNG, JPEG, or WebP. PNG suits crisp graphics and transparency work. JPEG keeps file size down for web use. WebP covers modern sites that want smaller files without visible quality loss. You pick the format after editing, not before.
Credit-Based Access
Every account starts with 20,000 lifetime credits, and paid plans add monthly allotments: 1,000,000 credits on Starter at $9.9/month and 3,000,000 on Pro at $19.9/month. Credits cover both generation and revisions, so the plan you need depends on how much you iterate.
Pros and cons
Pros
- AI builds a full infographic from a short brief, which removes the usual blank-page problem.
- The canvas lets you edit text, fonts, colors, and layout directly, so you aren't stuck with the first result.
- Chat-based revisions keep the layout intact while you rewrite or restyle sections.
- Reference uploads let your own images and text shape the output.
- Free tier and low entry price ($9.9/month) make it easy to test before committing.
Cons
- Browser-only with no desktop or mobile app, so offline work isn't possible.
- Credits cover both generation and revisions, so heavy iteration drains a plan faster than expected.
- The free tier's 20,000 lifetime credits run out quickly once you're iterating on real projects.
- API availability isn't documented, so developers can't rely on programmatic access yet.
Frequently asked questions
GraphicInfo creates infographics from a text prompt. You describe a topic or paste key facts, and it generates an editable HTML infographic you can refine by chat or on the canvas, then export as an image. It's aimed at anyone who needs a clear visual without design software.
Related content
Explore related tools, skills, and articles for GraphicInfo.
GraphicInfo Alternatives

Google EmbeddingGemma 2
Google DeepMind · Writing · Image · CodingGoogle EmbeddingGemma 2 is a 740M-parameter open model that turns text, code, images, audio, and video frames into vectors in one 768-dimension space, running on phones and laptops.

Tractionwave
TractionWave · Image · MarketingTractionWave is an AI attention heatmap tool for static ads. Upload a PNG or JPG and it returns predicted attention, ranked hotspots, and fixes before you spend budget.

Imejis.io
Imejis.io · Image · MarketingImejis.io is an AI design studio for agents and marketing teams. Describe an image in plain words, and it writes the copy, builds the layout, reflows it to every size, then exports a finished file.