

Graphy AI
Graphy Technologies Ltd. · Image · Coding · Productivity
Graphy AI is an AI graph maker that turns messy data into shareable charts and insights, built for marketers, analysts, and anyone who tells stories with numbers.
About Graphy AI
What Is Graphy AI
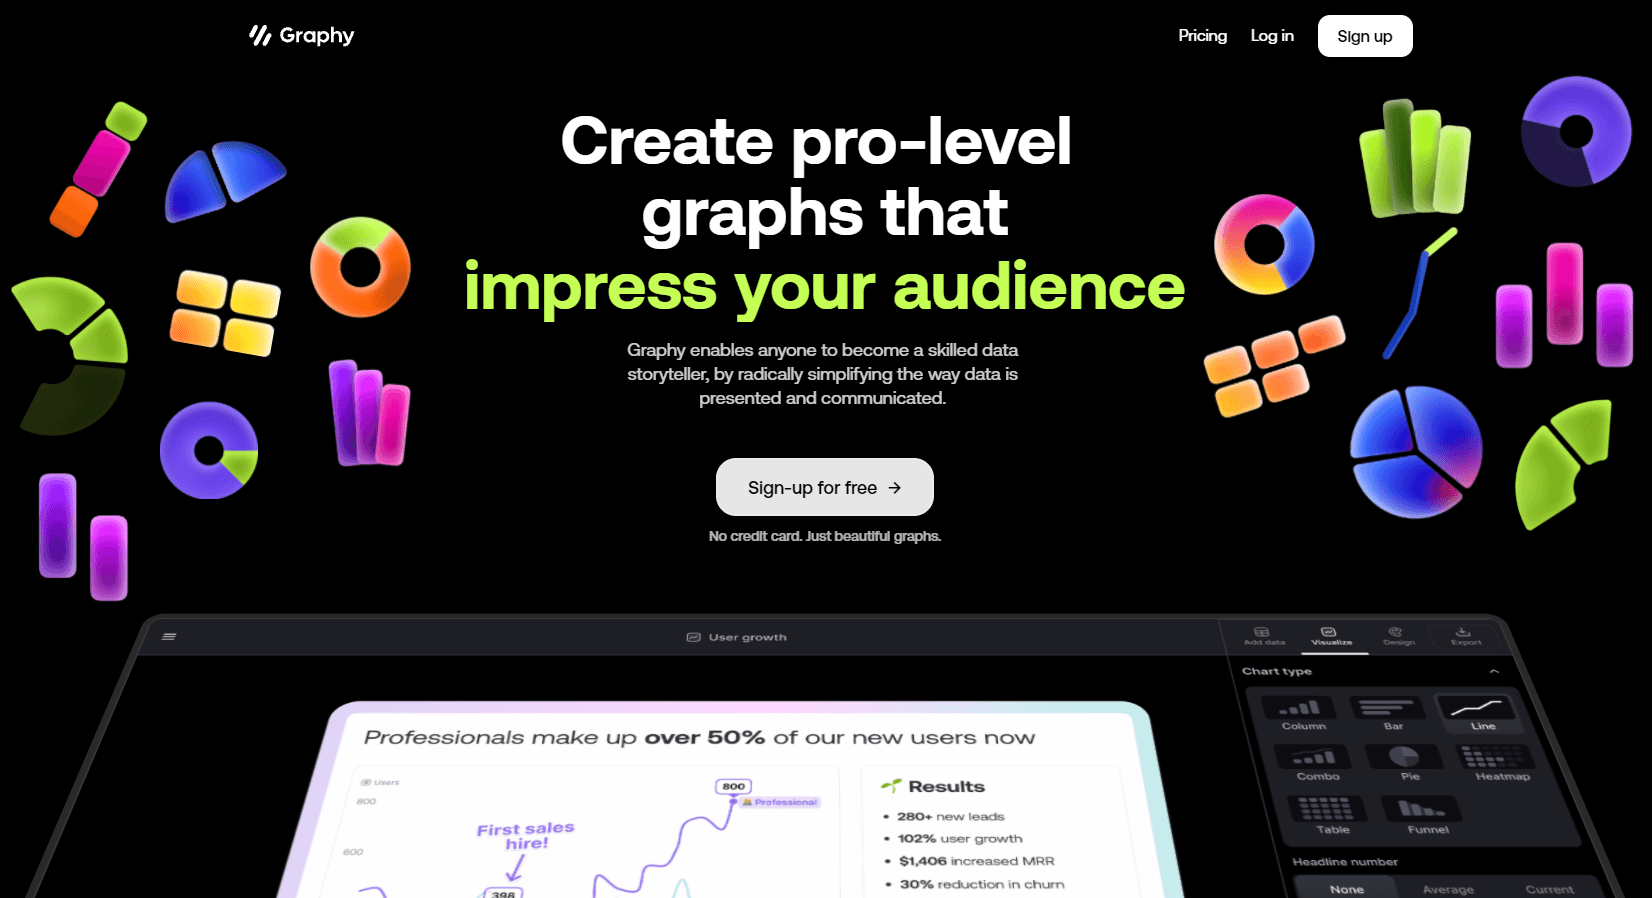
Graphy AI is an AI-powered data visualization tool that takes the pain out of charting by letting you bring a Google Sheet, a CSV, or an Excel file and then reading the dataset for you, picking chart types that fit, and highlighting the insights worth showing. No formulas. No dragging columns around for an hour.
So who's it for? The product targets people who need charts fast but don't live in spreadsheets. Marketers building campaign reports, founders prepping investor updates, and analysts who want a quick visual all fit comfortably. According to the company, more than 300,000 people already use it for data storytelling.
But there's a catch. The main trade-off is polish versus control. Graphy AI is quick, and it looks clean. But power users who want fine-grained formatting on every axis may keep reaching for a spreadsheet. The free plan also caps you at 5 charts and limited AI use, so heavy users will hit a wall quickly.
Getting Started
- Sign up at graphy.app and start on the free plan, no credit card needed.
- Add your data by linking a live Google Sheet, uploading a CSV or Excel file, pasting values, or asking the built-in AI to search for data.
- Let the AI engine scan the dataset and suggest chart types plus the insights that matter most.
- Chat with your data to swap chart types or pull a specific answer in seconds.
- Brand the chart with your colors and fonts, add annotations, then export or embed it wherever you share work.
Product Information
A quick look at Graphy AI's pricing, supported platforms, and performance.
Best for
The users, tasks, and scenarios where this tool fits best.
Users
- Marketers
- Startup founders
- Data analysts
- Team leads
Tasks
- Reporting
- Social and newsletter visuals
- Quick exploration
- Embedding charts
Scenarios
- Weekly performance reviews where a static chart beats another dashboard login.
- Pitching a new idea and needing one clean visual before the meeting.
- Turning a raw survey export into a readable result chart for a team.
- Publishing a data-driven post without opening a design tool.
Key features
AI chart generation from messy data
Graphy AI ingests a Google Sheet, CSV, or Excel file without asking you to format anything first. Its data engine reads the dataset, suggests fitting chart types, and points out the trends it finds. You always see how it reached a conclusion, which matters if you plan to share the chart with people who'll question the numbers.
Chat with your data
Instead of hunting through menus, you type what you want. Ask for a chart, an insight, or a specific answer, and it returns in seconds. That's the fastest path from a raw file to something presentable, and it's also the feature that separates Graphy AI from a plain chart maker.
Branding and annotations
You can apply your own colors and fonts to every chart in one move, and annotations let you call out a win, a dip, or a deadline directly on the visual you're about to share. The result looks like it came from your brand rather than a generic template. That helps with social posts and client reports alike.
Multiple export and embed options
Charts can be exported as images or embedded into other tools, which covers slide decks, docs, newsletters, and websites without a separate design step. And interactive charts keep viewers engaged when they're embedded. A static screenshot can't do that.
Charting SDK and API for developers
Graphy offers a typed charting library for React, where one config object drives bar, line, pie, funnel, heatmap, and more. Developers can install it with npm, pass their data, and render editable charts inside their own product without touching CSS overrides or wrapper divs. Short version: one API, every chart. An agentic API also lets AI agents describe a change and receive a validated chart config.
Live data connections
Linking a Google Sheet keeps charts current without manual re-uploading. The data stays in sync, so a report you shared last week still shows the right numbers this week. For teams sending regular updates, that alone saves a stack of copy-paste time, and it means the chart sitting in someone's inbox still matches the dashboard nobody remembered to refresh. Worth every cent of the upgrade.
Team sharing and password-protected links
Paid plans let you invite team members and share charts through protected links, so you can circulate a report widely without bumping into per-user limits. Viewers don't need a paid seat. That fits internal reporting, where the audience is usually bigger than the editor list and nobody wants to buy ten licenses just to read one chart.
Pros and cons
Pros
- Turns raw CSV, Excel, or Google Sheets data into charts without manual formatting.
- AI suggestions and chat make chart building fast, even for people who avoid spreadsheets.
- Strong branding controls keep output consistent with your colors, fonts, and annotations.
- Live Google Sheets connection keeps shared reports up to date automatically.
- Developer SDK and API let teams embed editable charts inside their own products.
Cons
- Free plan caps you at 5 charts with limited AI use, so regular users need a paid tier.
- Watermark removal and unlimited AI are locked behind the Plus plan at $16 per user/month.
- Business features like brand kits and protected links push the price to $36 per user/month.
- Deep manual formatting is limited compared with building charts by hand in a spreadsheet.
Frequently asked questions
Graphy AI is used to create charts and data visualizations from spreadsheets and files without manual setup. It suits reporting, presentations, social posts, and any task where you need to explain numbers quickly.
Related content
Explore related tools, skills, and articles for Graphy AI.
Graphy AI Alternatives

Google EmbeddingGemma 2
Google DeepMind · Writing · Image · CodingGoogle EmbeddingGemma 2 is a 740M-parameter open model that turns text, code, images, audio, and video frames into vectors in one 768-dimension space, running on phones and laptops.

Tractionwave
TractionWave · Image · MarketingTractionWave is an AI attention heatmap tool for static ads. Upload a PNG or JPG and it returns predicted attention, ranked hotspots, and fixes before you spend budget.

Imejis.io
Imejis.io · Image · MarketingImejis.io is an AI design studio for agents and marketing teams. Describe an image in plain words, and it writes the copy, builds the layout, reflows it to every size, then exports a finished file.