
Microsoft Excel: Spreadsheets
Microsoft · Image · Productivity
Microsoft Excel is a spreadsheet app for budgets, tracking and data analysis, built on Excel formulas, pivot tables and now Copilot assistance.
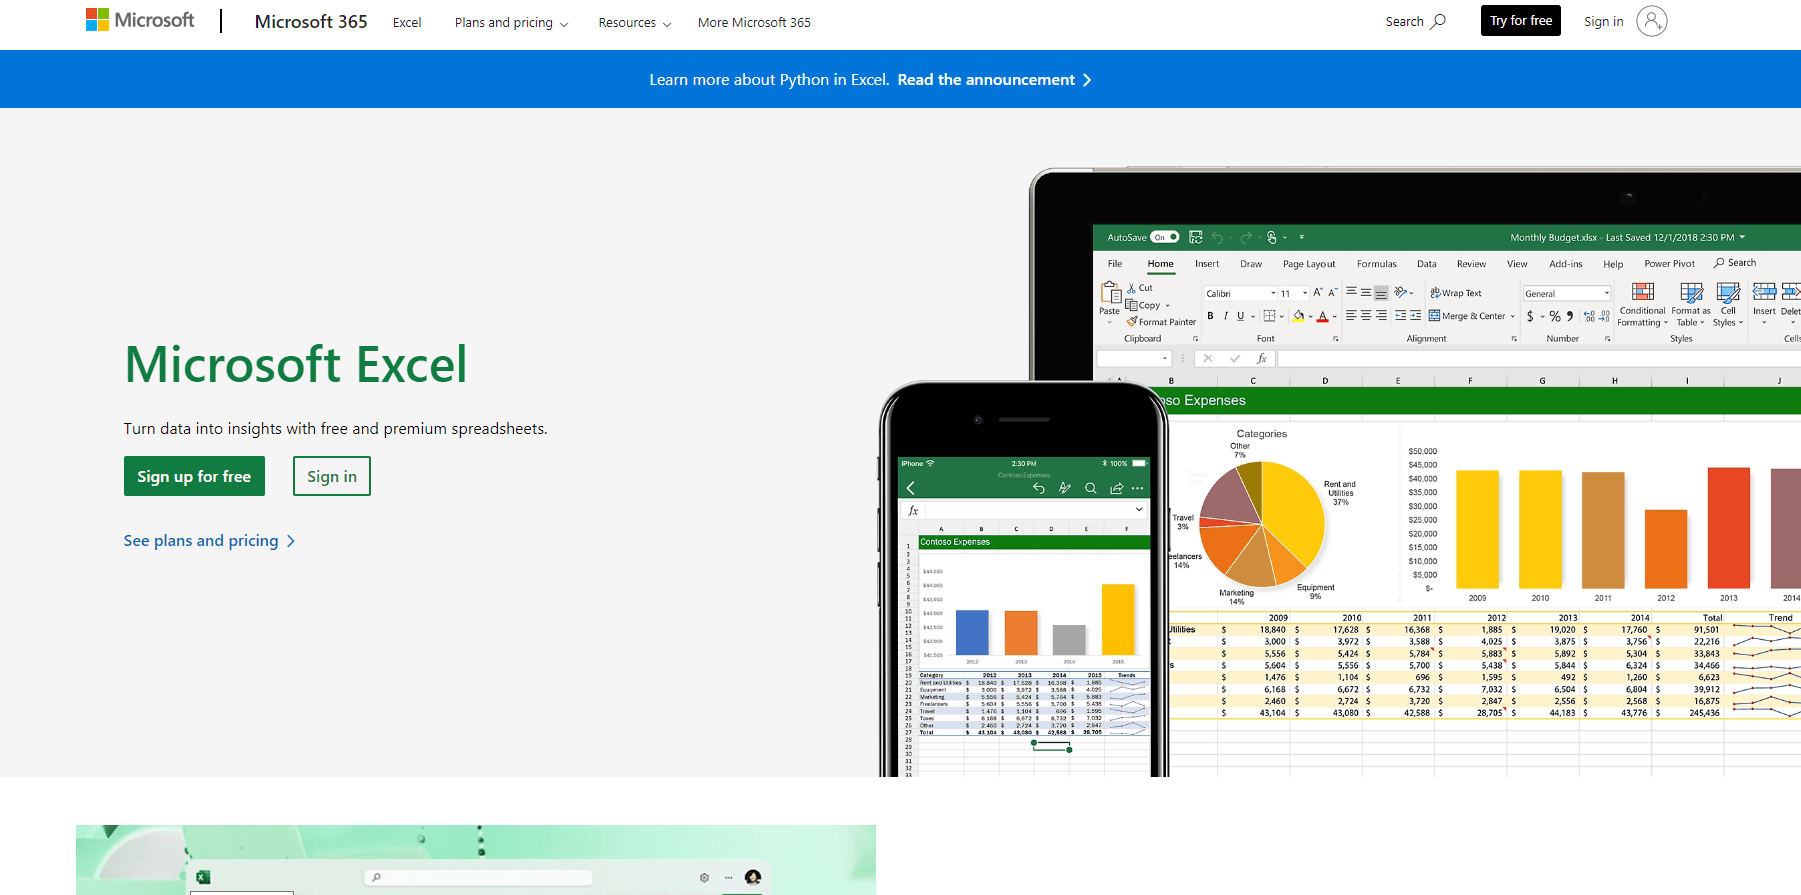
About Microsoft Excel: Spreadsheets
What Is Microsoft Excel
Microsoft Excel is the spreadsheet software most offices run on. You get a grid of cells, each one holding a number, a label or a formula that recalculates when something upstream changes. That single design covers a surprising range of work: a household budget spreadsheet, a sales pipeline, a class grade book, a 40 tab financial model.
The job it does well is turning messy records into something you can total, filter and compare. Paste in a CSV export, sort it, group it, chart it, and you have an answer in minutes. Excel formulas handle the arithmetic, pivot tables handle the summarizing, and conditional formatting makes the outliers visible without reading every row.
The limits matter too. The desktop app runs on Windows and macOS only, and the full feature set needs a paid Microsoft 365 or Office 2024 license. Excel for the web is free but drops macros, Power Query and some add-ins, and caps file size. Very large datasets, the kind measured in tens of millions of rows, belong in a database rather than a workbook.
Getting Started
- Open excel.cloud.microsoft in a browser for the free version, or install the desktop app through a Microsoft 365 subscription or a one-time Office 2024 purchase.
- Sign in with a Microsoft account, then start from a blank workbook or pick a template for budgets, invoices, schedules and trackers.
- Type your column headers, paste your data underneath, and add an Excel formula such as SUM or XLOOKUP to turn raw rows into totals and lookups.
- Format the sheet, insert a chart, then share the file or invite people to edit it at the same time.
Product Information
A quick look at Microsoft Excel: Spreadsheets's pricing, supported platforms, and performance.
Best for
The users, tasks, and scenarios where this tool fits best.
Users
- Students
- Small business owners
- Financial analysts
- Project managers
Tasks
- Building a budget spreadsheet
- Cleaning exported data
- Building a dashboard
- Modeling a loan or a price change
Scenarios
- Monthly close
- One-off what-if questions
- Team trackers
Key features
Copilot in Excel
Copilot writes formulas from a plain description, spots trends, and builds pivot tables or charts on request. Ask it to flag late payments and it returns a formula plus a short explanation of what the formula does. Answers still need checking, especially on messy data, so treat it as a fast first draft rather than a final result. It ships with Microsoft 365 Personal, Family, Premium and Pro plans.
Formulas and Functions
Excel formulas are the core of the product: more than 450 functions covering math, text, dates, lookups and statistics. XLOOKUP and FILTER replaced most of the old VLOOKUP and array workarounds, and dynamic arrays spill results into neighboring cells without extra setup. The formula bar autocompletes function names and shows argument hints, which shortens the lookup time for occasional users.
PivotTables and Power Query
Pivot tables summarize thousands of rows into a cross tab you can drag around: sales by region by quarter, hours by project by person. Power Query goes further and records each cleanup step, so next month's file gets the same treatment with one refresh. This pair is why Excel remains the default for data analysis work that never quite graduates to a BI tool.
Charts and Conditional Formatting
Column, line, combo and waterfall charts cover most reporting needs, and they update the moment the source numbers change. Conditional formatting highlights values against rules you set, so a budget overrun turns red before anyone reads the cell. Sparklines fit a whole trend line inside one cell for compact dashboards.
Real-Time Collaboration in Excel for the Web
Excel for the web runs the same file in a browser, free with a Microsoft account. Several people can edit at once, comment threads stay attached to cells, and version history lets you restore an earlier state. Co-authoring works in the desktop app too, as long as the workbook sits on OneDrive or SharePoint.
Automation With Macros and Office Scripts
Macros record a sequence of clicks and replay it on demand, which kills repetitive formatting and report assembly. Office Scripts does the same job with TypeScript for the web and desktop, and Power Automate can trigger a script on a schedule or a new file. Both need a paid license, and macros stay blocked in the browser version.
Pros and cons
Pros
- The .xlsx file format is the default that accountants, banks and suppliers expect, so sharing rarely needs a conversion.
- The function library covers nearly every calculation a small team needs, from currency conversion to statistical tests.
- Pivot tables and Power Query turn raw exports into summaries without writing code.
- The free web version handles everyday editing and collaboration at no cost.
- Templates and tutorials are everywhere, which shortens the ramp for new users.
Cons
- The desktop app requires a subscription or a one-time Office 2024 purchase, so the real cost shows up every year.
- Advanced features such as Power Query, macros and data models take weeks to learn properly.
- The web version drops macros and Power Query, and slows down on large workbooks.
- Copilot suggestions can be wrong on inconsistent data, which means manual verification stays part of the job.
Frequently asked questions
There is a free version: Excel for the web, available with any Microsoft account at excel.cloud.microsoft. It covers editing, formulas, charts and co-authoring. The desktop app is not free, and it comes with a Microsoft 365 subscription or a one-time Office 2024 license.
Related content
Explore related tools, skills, and articles for Microsoft Excel: Spreadsheets.
Microsoft Excel: Spreadsheets Alternatives

Google EmbeddingGemma 2
Google DeepMind · Writing · Image · CodingGoogle EmbeddingGemma 2 is a 740M-parameter open model that turns text, code, images, audio, and video frames into vectors in one 768-dimension space, running on phones and laptops.

Tractionwave
TractionWave · Image · MarketingTractionWave is an AI attention heatmap tool for static ads. Upload a PNG or JPG and it returns predicted attention, ranked hotspots, and fixes before you spend budget.

Imejis.io
Imejis.io · Image · MarketingImejis.io is an AI design studio for agents and marketing teams. Describe an image in plain words, and it writes the copy, builds the layout, reflows it to every size, then exports a finished file.