

Onvo AI
Onvo AI Inc. · Image · Coding
Onvo AI turns databases and spreadsheets into live dashboards. You ask questions in plain English, get charts and written answers, then share or embed the result.
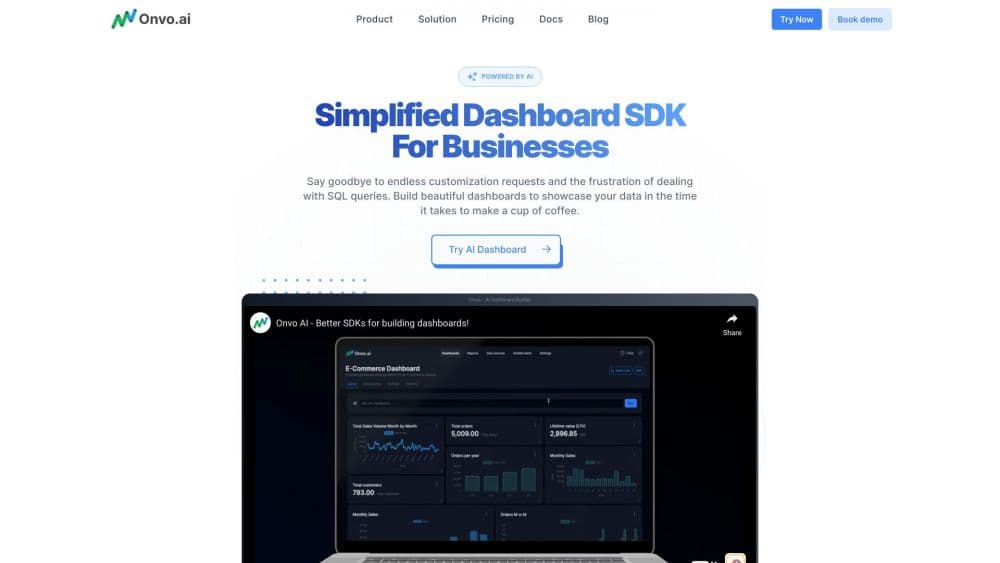
About Onvo AI
What Is Onvo AI
Onvo AI is an AI dashboard builder for data you already have. You paste a database URL, upload a spreadsheet, or connect Google Sheets and Airtable, and it assembles charts you can filter, question, and send to other people. The company positions it for teams that want answers without waiting on an analyst.
The work it removes is the setup around the chart. Onvo reads table relationships on its own, notices merged cells and broken date formats, and repairs them before a dashboard gets built. Ask "why did sales drop last week" and the AI data analyst queries the data, explains the result, and hands you a chart you can drop onto a board with one click.
Two limits matter. The output is only as good as the definitions behind your numbers, so a team that argues about what counts as an active user will still argue. And this is a lightweight analytics layer, not a governed enterprise BI stack with audited metric definitions. Teams with strict compliance requirements should check the details with sales before committing.
Getting Started
- Sign up at onvo.ai. The trial runs 14 days and doesn't ask for a card.
- Connect a source. Paste a PostgreSQL, MySQL, Snowflake, or BigQuery connection string, upload CSV or Excel, or link Google Sheets and Airtable.
- Review the cleanup pass. Onvo lists the rows it fixed, the merged cells it split, and the dates it normalized, so you can see what changed before you trust a number.
- Ask a question or describe a chart. Type a prompt such as "revenue by region last quarter" and add the result to a dashboard.
- Share it. Set a refresh schedule, export a PDF, send reports on a timetable, or embed the dashboard inside your own product.
Product Information
A quick look at Onvo AI's pricing, supported platforms, and performance.
Best for
The users, tasks, and scenarios where this tool fits best.
Users
- Startup founders and small ops teams
- Agencies and SaaS product teams
- Non-technical managers in sales, marketing, and finance
Tasks
- Weekly revenue and ops reporting
- Ad-hoc data questions
- Client reporting
- Embedding dashboards in a product
Scenarios
- A partner sends an Excel file with merged cells and three date formats
- An investor asks for retention numbers during a call
- A dashboard needs a new view before a board meeting
Key features
Any Data Source, Connected in Seconds
Onvo takes PostgreSQL, MySQL, Microsoft SQL Server, MongoDB, ClickHouse, Firestore, Snowflake, BigQuery, Airtable, Google Sheets, CSV, and Excel, plus anything with a JDBC or REST connection. You paste a URL or drop a file, and there's no schema configuration step. Getting a dashboard from a database takes about as long as pasting a connection string. For a small team, that's the difference between a dashboard this afternoon and a migration project.
Automatic Cleanup Before the First Chart
Merged cells, empty rows, mixed date formats, and #VALUE! errors get found and fixed before Onvo builds anything. The platform shows what it changed, which matters if you've ever had a chart quietly count a text cell as zero. You still spot-check the output, but the boring part is done.
An AI Analyst That Answers in Words
The chat panel accepts questions like "show me top customers by region" and returns a written explanation with supporting charts, including maps when the data has location fields. It's aimed at natural language data queries rather than a query builder, so the answer reads like a colleague's summary. Useful charts can be pinned to a dashboard in one click.
Prompt-Based Chart Editing
You can change a chart by describing the change: "make this a bar chart" or "show only the top five values". Onvo rebuilds it without menus. This is the feature that keeps a dashboard alive after launch, because most people abandon boards they can't adjust without help.
Scheduled Reports and Live Refresh
Set a source to refresh hourly, daily, or on a custom schedule, and the board stays current without manual exports. Scheduled reports can deliver a PDF to an inbox or fire a webhook for your own systems. That covers the weekly update ritual without anyone rebuilding the same deck.
Client Workspaces and Embedded Analytics
One login can hold several isolated projects, so an agency can keep each client's data walled off. Brand colors, terminology, and chart styles get applied across boards once you set them. Embedded analytics then puts those boards inside your own product, which is the main reason SaaS teams pick this over a generic BI tool.
Pros and cons
Pros
- Connection setup takes a URL or a file upload, with no schema work.
- The cleanup pass is visible, so you can see which rows Onvo changed.
- Plain English questions return a written answer plus a chart, not just a number.
- Client workspaces and embedding cover the agency and SaaS use cases in one tool.
- The 14-day trial needs no credit card, so testing a real dataset is cheap.
Cons
- Pricing isn't published. The pricing link routes to a demo request, so you can't budget without talking to sales.
- There's no governed semantic layer. Metric definitions live in your head and your data, not in an audited model.
- Analysts who want to write SQL against the warehouse will find the prompt interface limiting.
- Large enterprises with strict row-level security and audit requirements will likely need a heavier BI platform.
Frequently asked questions
It connects to a database or spreadsheet, cleans the data, and builds live dashboards you can question in plain English. You end up with charts, written answers, scheduled reports, and boards you can share or embed.
Related content
Explore related tools, skills, and articles for Onvo AI.
Onvo AI Alternatives

Google EmbeddingGemma 2
Google DeepMind · Writing · Image · CodingGoogle EmbeddingGemma 2 is a 740M-parameter open model that turns text, code, images, audio, and video frames into vectors in one 768-dimension space, running on phones and laptops.

Tractionwave
TractionWave · Image · MarketingTractionWave is an AI attention heatmap tool for static ads. Upload a PNG or JPG and it returns predicted attention, ranked hotspots, and fixes before you spend budget.

Imejis.io
Imejis.io · Image · MarketingImejis.io is an AI design studio for agents and marketing teams. Describe an image in plain words, and it writes the copy, builds the layout, reflows it to every size, then exports a finished file.