
OpenObserve
OpenObserve · Coding · Productivity
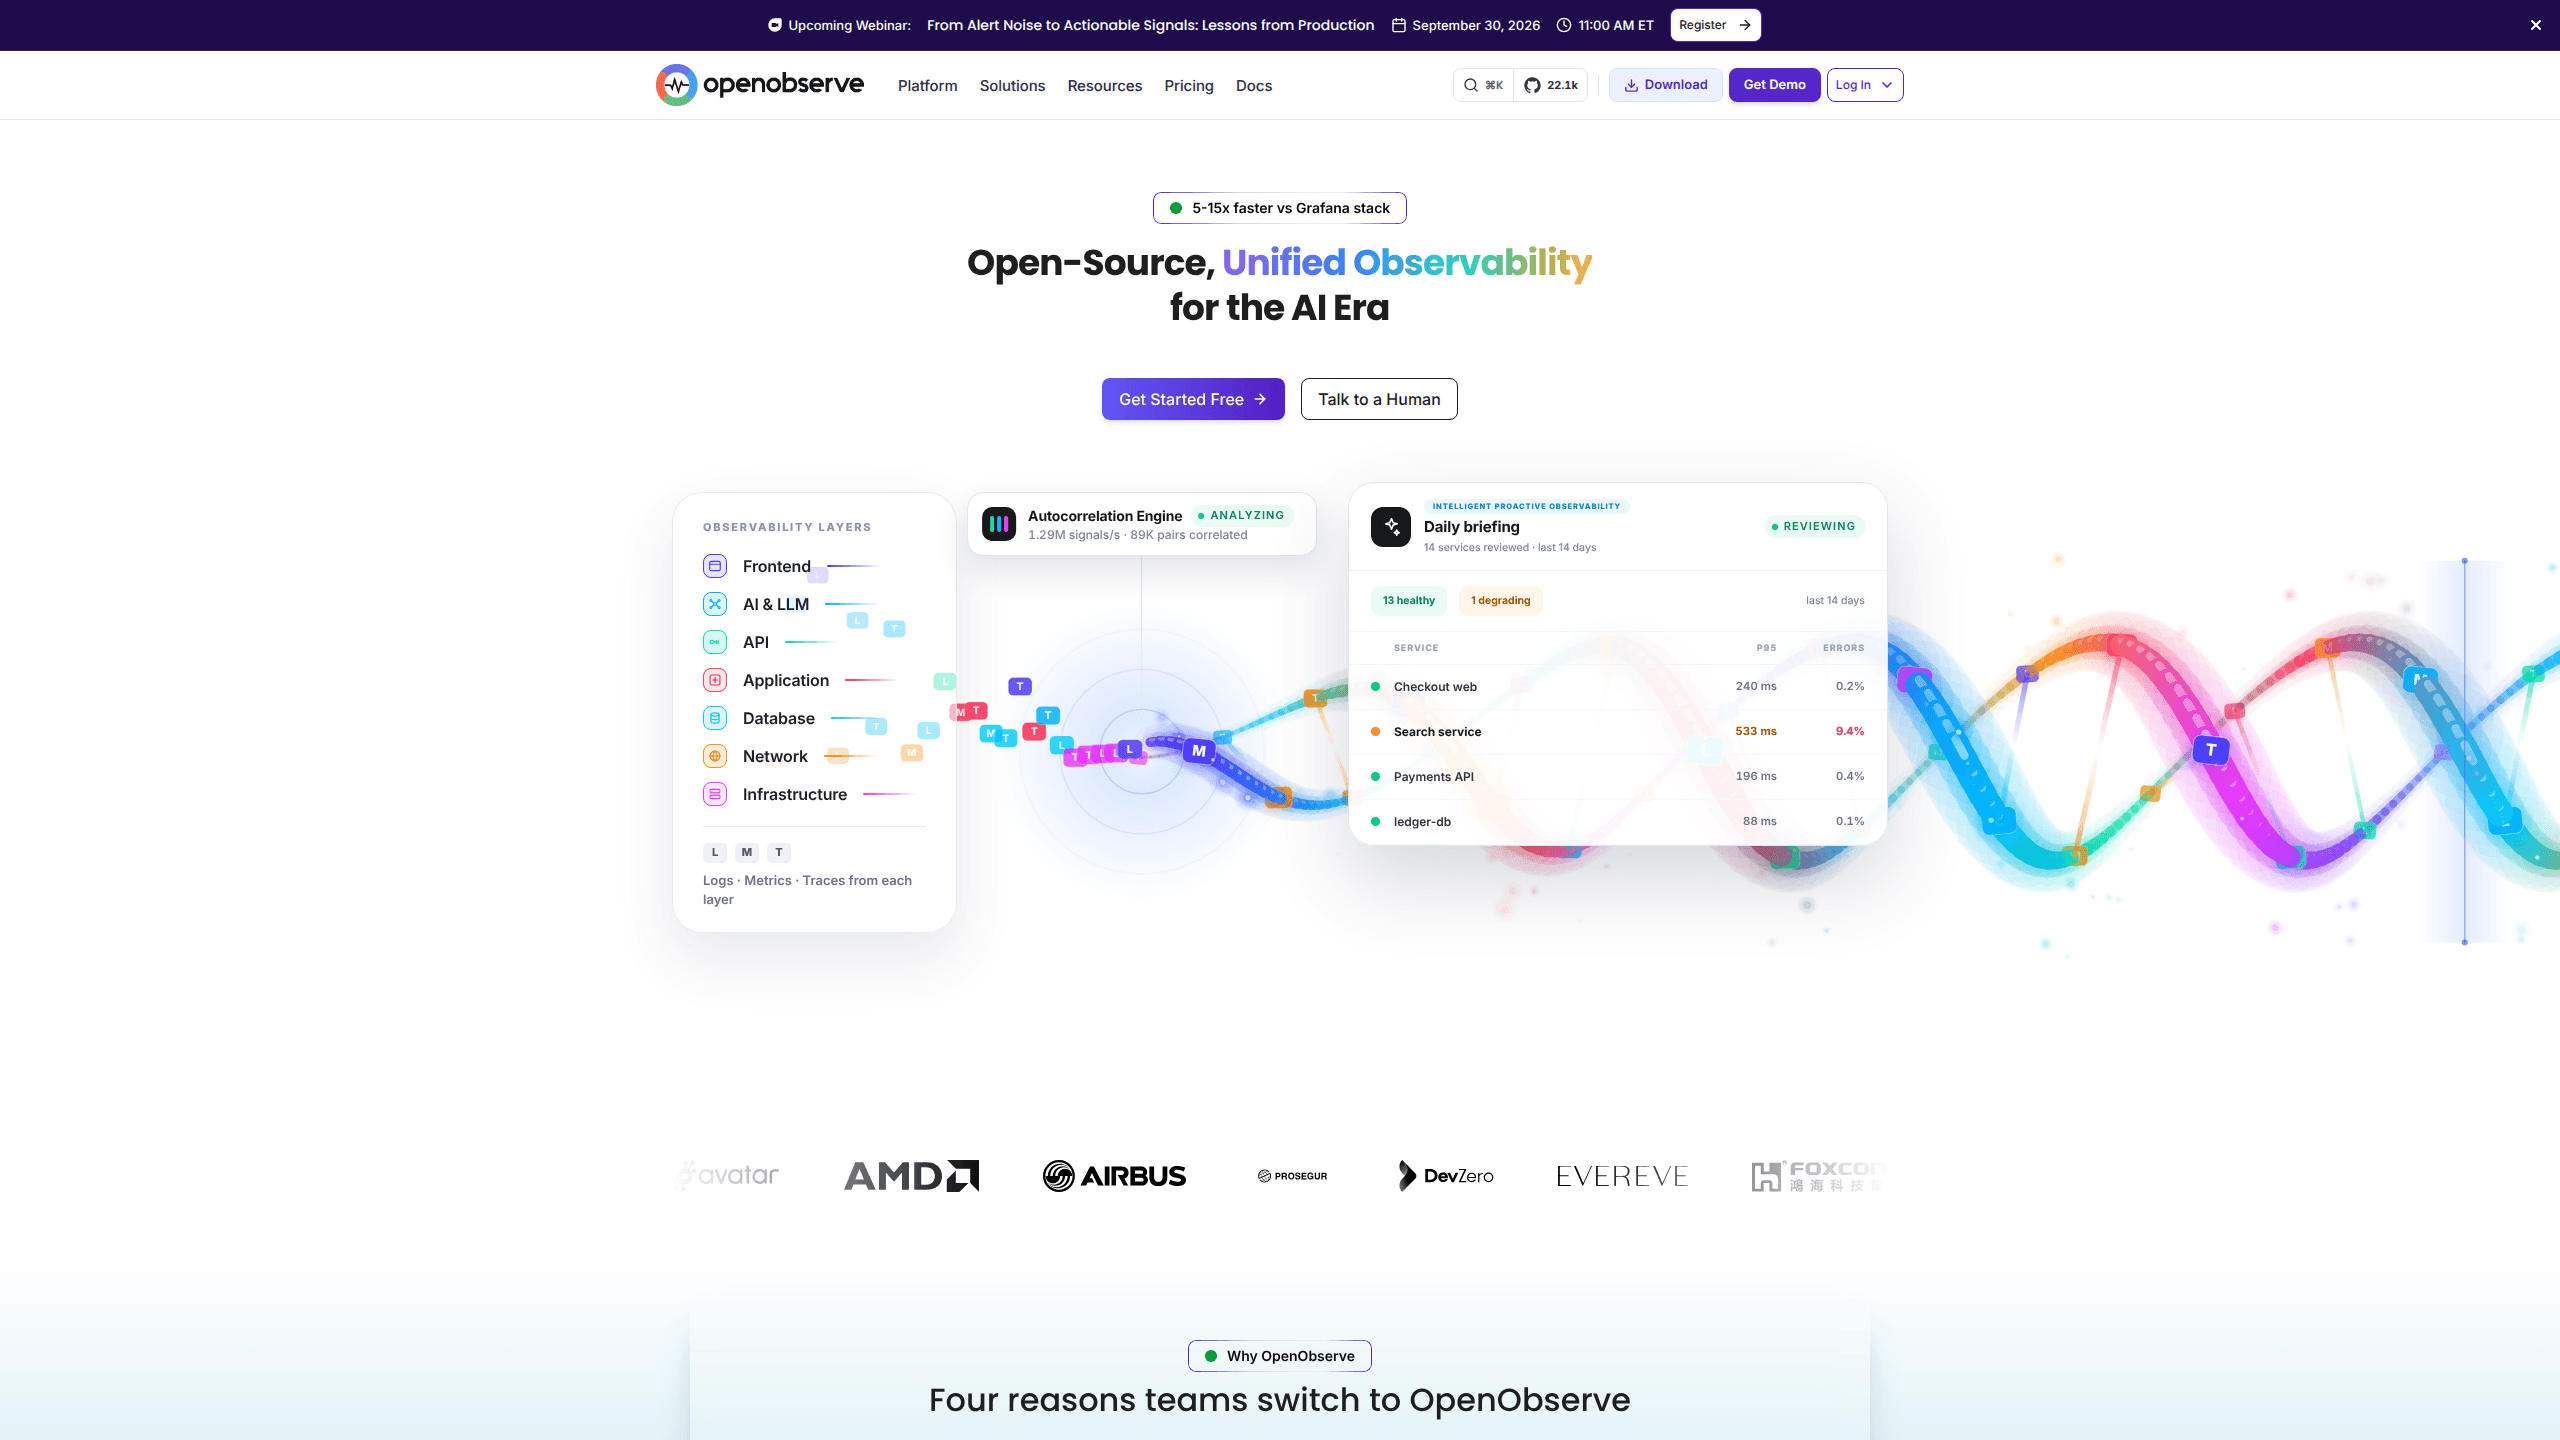
OpenObserve is an open source observability platform that brings logs, metrics, traces, real user monitoring, and LLM observability into one tool. It's built as a cheaper, simpler alternative to Datadog, Splunk, and Elasticsearch, with pay-per-GB pricing and a single-binary deployment that gets a working instance running in minutes. Teams reach for it when storage bills are growing faster than the value they get from the data.
About OpenObserve
What Is OpenObserve
OpenObserve is a cloud-native observability platform for the data your systems constantly produce: log lines, metrics, and traces. It's one place for all of it. The project appeared in 2022 to solve a specific frustration. Teams were paying more and more to store telemetry they could barely search, spread across tools that never quite fit together. OpenObserve puts every signal in one place and stores it in Parquet columnar format on object storage, which is how it claims storage costs up to 140 times lower than Elasticsearch.
You can run it as a managed cloud service, or self-host the open source core under AGPL-3.0. Both paths accept data through OpenTelemetry, so instrumenting your app once doesn't lock you into a single vendor. The SQL and PromQL query languages mean anyone who's written a database query already knows how to dig into their data.
The biggest limitation is scale on the free self-hosted path. Single-node setups fit evaluation and small production loads, but high-availability clustering and long retention usually push teams toward the cloud tiers or the enterprise edition. Support also works differently here. The community helps through Slack and GitHub, while paid plans add the SLAs and account management that larger companies expect.
Getting Started
- Sign up for the managed cloud at cloud.openobserve.ai, or run the Docker command from the OpenObserve homepage to start a self-hosted instance locally.
- Open the web UI (localhost:5080 for the local Docker setup) and log in with your root credentials.
- Point your application's OpenTelemetry exporter at OpenObserve, or connect an existing data source, so streams start flowing in.
- Explore incoming data in the logs, metrics, and traces views, then build a dashboard or alert around what matters most.
Product Information
A quick look at OpenObserve's pricing, supported platforms, and performance.
Best for
The users, tasks, and scenarios where this tool fits best.
Users
- Backend and platform engineers
- DevOps and SRE teams
- Startups watching cloud spend
Tasks
- Centralizing log management
- Distributed tracing
- LLM observability
Scenarios
- Migrating off Datadog or Splunk to cut a runaway observability bill
- Debugging a production outage across services
- Monitoring an AI-powered feature in production
Key features
Unified Log, Metric, and Trace Analytics
OpenObserve stores all three major signal types in a single platform rather than three separate tools. You get one search bar, one dashboard builder, and one place to correlate a spike in error logs with the trace that caused it. That correlation is the whole point. When you're chasing a live incident, switching tabs costs time you don't have.
OpenTelemetry-Native Ingestion
The platform is built on the OpenTelemetry standard, so your existing instrumentation sends data without custom adapters. That's a real hedge against vendor lock-in, which is rare among commercial monitoring tools. Because the format is open, you can move to or from other backends later without rewriting your collectors.
Parquet Storage on Object Storage
Logs and traces land in Parquet columnar files on S3-compatible object storage. Compression and columnar layout are what drive the claimed 140x storage savings versus Elasticsearch. For teams that keep years of data for compliance, that difference shows up directly on the invoice.
SQL and PromQL Querying
You query logs and traces with SQL and metrics with SQL or PromQL. No proprietary query language to learn. If your team already writes SQL daily, the learning curve is close to zero, and PromQL lets existing Grafana users bring their dashboards along.
Real User Monitoring and Session Replay
Beyond backend signals, OpenObserve captures Real User Monitoring data from web, Android, and iOS apps. Session replay shows what a user actually did before they hit an error, which often answers questions log lines can't. Frontend and backend context live in the same tool.
AI and LLM Observability
The platform tracks AI agent and LLM behavior as a first-class signal, covering prompt flows and token usage. As more products embed models, this gives teams a way to watch cost and quality of AI features next to everything else. An AI assistant also helps summarize and troubleshoot within the UI.
Alerts, Dashboards, and SLOs
Dashboards, alerting, and service-level objectives ship in the core product. You define what good looks like, and the platform tells you when reality drifts. Alerts run against the same data you're querying, so thresholds stay consistent with your investigations.
Pros and cons
Pros
- Pay-per-GB pricing with no per-host or per-seat fees keeps costs predictable as teams grow
- Single-binary deployment gets a working instance running in under two minutes
- OpenTelemetry-native and open source core (AGPL-3.0) reduce vendor lock-in
- Unified logs, metrics, traces, RUM, and LLM observability save context-switching between tools
- SQL and PromQL support means most engineers already know the query syntax
Cons
- Self-hosting at scale needs real infrastructure work, so small teams may end up on paid cloud tiers anyway
- The AI and LLM observability features are newer than the core signals, so expect less polish there
- Community support replaces dedicated account help unless you're on an enterprise plan
- Fine-grained cost control depends on managing ingestion volume, which takes ongoing attention
Frequently asked questions
It's used to collect and analyze the operational data your software produces: logs, metrics, and traces, plus frontend and LLM signals. Teams use it to debug incidents, monitor performance, and cut the cost of storing telemetry. It works as a self-hosted open source install or a managed cloud service.
Related content
Explore related tools, skills, and articles for OpenObserve.
OpenObserve Alternatives
Forefront
Forefront · CodingForefront is a web platform for building with open-source AI. It lets you fine-tune leading open-source language models on your own data, evaluate how they perform, and run them through an API or export them to host yourself. Developers who want the convenience of a closed-source platform but insist on owning their models and data are the target audience here.

Startkit
StartKit.AI · CodingStartkit is a boilerplate for building AI SaaS and AI wrapper products. Think of it as an AI startup boilerplate with the boring parts already wired up: authentication, Stripe and Lemon Squeezy payments, usage limits, transactional email, and an AI API starter that talks to OpenAI, Anthropic, Groq, or Llama. You clone the repo, set your price, and start on the part of your product that people actually pay for. It's Next.js under React and Tailwind, so most of the boilerplate code already feels familiar.
Testim
Tricentis · CodingTestim is an AI-powered test automation platform for building and running end-to-end tests across web, mobile, and Salesforce applications. It leans on machine learning to keep tests stable when an interface changes, so teams spend less time fixing broken selectors. Not bad for an automated testing tool you can start using today. You create tests by recording actions in a browser, then optionally add JavaScript when you need more control. It's a solid pick for busy QA teams.