

paper banana
Google Cloud AI Research and Peking University · Image · Productivity
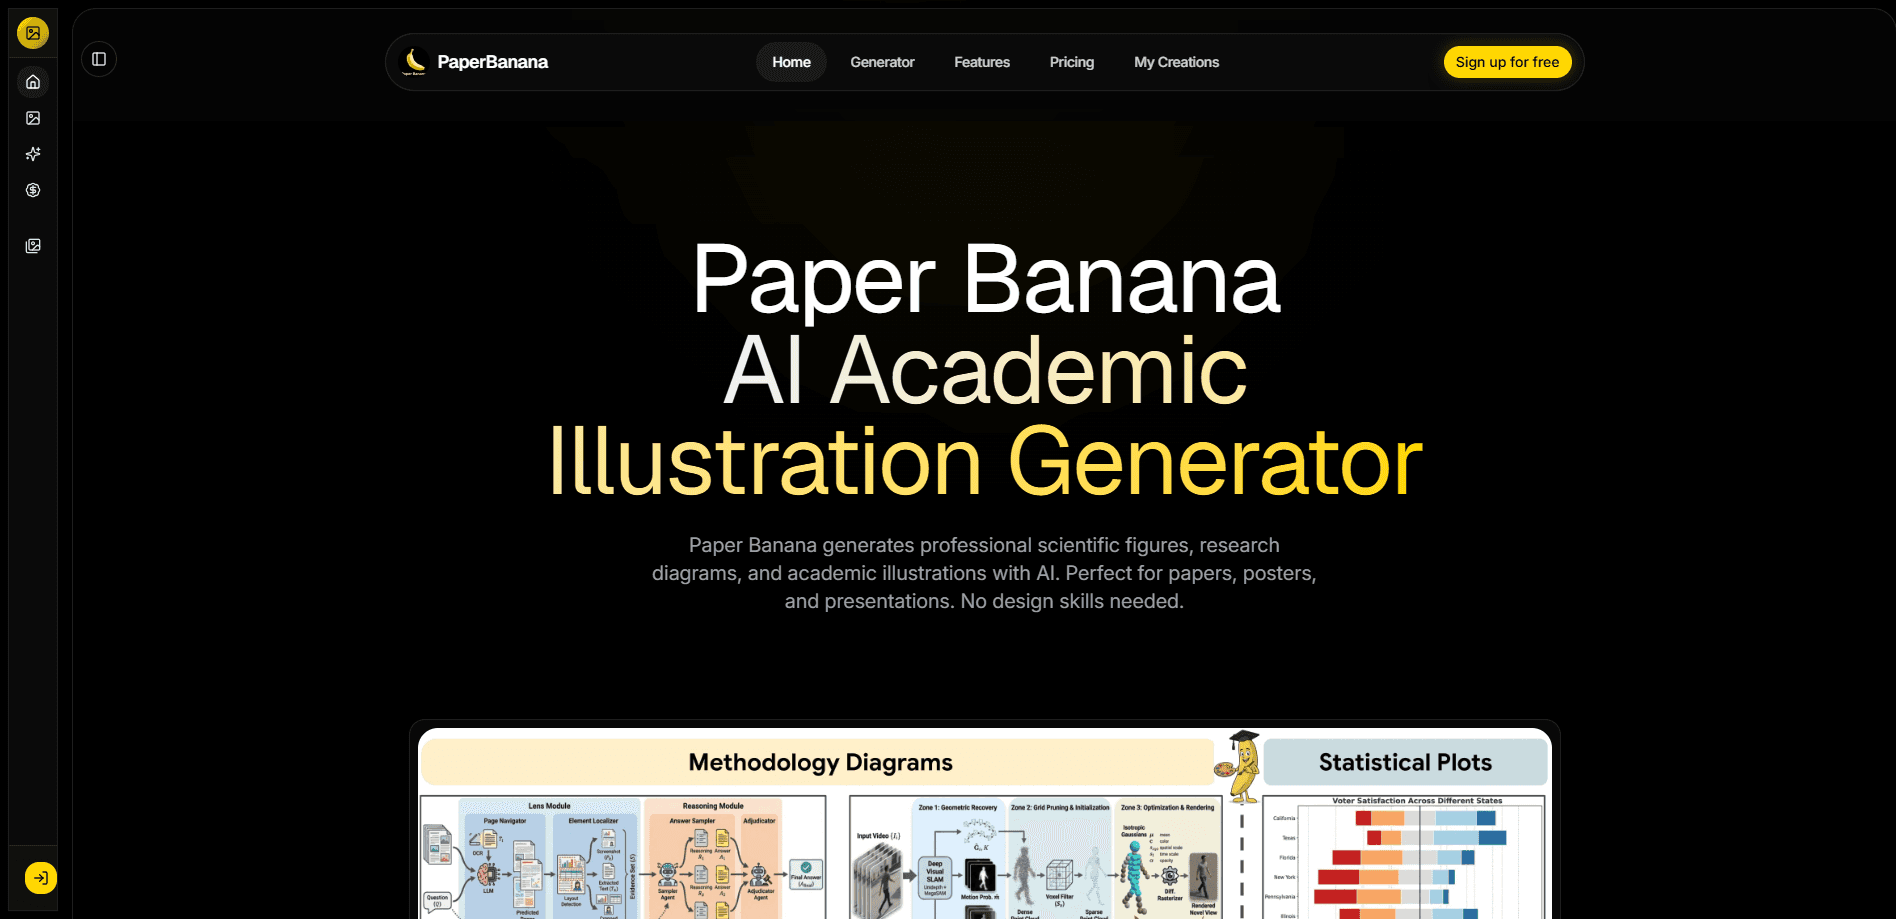
PaperBanana is an agentic framework that generates publication-ready academic illustrations from plain text. You feed it a method description and a figure caption, and a team of specialized AI agents returns method diagrams or statistical plots suited to venues like NeurIPS and ICML. It's an academic illustration generator that targets researchers. It also works as a general AI diagram generator for slides and technical docs. It's built for AI scientists who'd rather spend their hours on ideas than on wrestling with vector tools.
About paper banana
What Is PaperBanana
PaperBanana is a multi-agent system built by Google Cloud AI Research and Peking University to automate one stubborn bottleneck in research: making figures. Writing the paper is hard enough. Drawing a clean architecture diagram or a plot that reviewers won't complain about can eat another day. It's the kind of research figure tool that hands the drawing back to the machine.
The framework splits the job across five cooperating agents. A Retriever pulls similar examples from a reference library, a Planner reads your method text and writes a detailed drawing spec, a Stylist applies academic aesthetic rules, a Visualizer renders the image or code, and a Critic checks the result against your original text and sends it back for another pass. That loop is the point. A single image model renders something pretty; PaperBanana checks whether that something is actually correct.
The main limitation is worth stating up front. On dense diagrams with many nodes, diffusion-based rendering can warp text or misplace connecting lines, and pixel-precise data plots still invite errors when they're generated purely as images. Not ideal. The team's answer is a code-driven path for plots, which matters if your figures carry real numbers. The project started as a research paper, and community implementations have since added CLI, Python API, and MCP server access for tools like Claude Code and Cursor.
Getting Started
- Open the project page and clone the repository, then install dependencies with
pip install -r requirements.txt. - Add API keys for your chosen provider in the model config file. Community builds support OpenAI, Azure OpenAI or Foundry, Google Gemini, and Atlas Cloud.
- Prepare two inputs: the source context (the method section from your paper) and the communicative intent (the figure caption you want).
- Optionally load a reference set of published (method text, caption, figure) triples. The bundled PaperBananaBench ships 292 reference cases from NeurIPS 2025.
- Run generation, then pick the best result. The authors recommend a generate-and-select workflow: produce three to five candidates and choose the one that matches your paper's style.
Product Information
A quick look at paper banana's pricing, supported platforms, and performance.
Best for
The users, tasks, and scenarios where this tool fits best.
Users
- AI researchers and grad students
- Lab teams writing multiple papers a year
- Researchers polishing existing drafts
Tasks
- Building a model architecture diagram
- Generating statistical plots
- Producing concept framework figures
Scenarios
- The night before a deadline when figures are the last thing left
- Turning a conference talk's rough sketch into a clean slide figure
- Revising a rejected submission
Key features
Five-agent pipeline
PaperBanana runs Retriever, Planner, Stylist, Visualizer, and Critic in sequence. Each one owns a single job. That's what keeps the output close to your text instead of drifting into generic stock imagery. The Critic closes the loop by comparing the rendered figure against the source content and flagging mismatches.
Reference-guided generation
With a reference set loaded, the Retriever picks the ten most relevant published examples and the Stylist distills their colors, shapes, and typography into a style guide. Your paper figures inherit conventions from real papers in your field rather than an average of everything the model has seen.
Method diagram automation
Given a method section, the system produces the kind of architecture or process figure you'd normally build in Figma or TikZ. It handles the layout and labeling that make a diagram readable at a glance, which is the part that usually costs the most time.
Statistical plots with code
For charts where the numbers have to be right, PaperBanana can write and execute Python plotting code instead of rendering pixels. This keeps your data faithful. It also gives you editable Matplotlib or Seaborn source you can tweak later. Pixels are pretty; numbers win reviews.
Style enhancement for existing figures
You can feed in a rough sketch and get back a version with cleaner layout and unified academic styling. It's a practical choice when the science is settled and only the presentation is holding the figure back. No redraw needed.
Multiple provider support
Community builds connect to OpenAI, Azure OpenAI or Foundry, Google Gemini, and Atlas Cloud. Gemini makes a low-cost entry point, and swapping providers doesn't change the agent workflow.
CLI, Python API, and MCP server
The framework fits into how you already work: batch runs from a YAML or JSON manifest, scripted calls from Python, or an MCP server wired into Claude Code and Cursor. Batch generation is handy when a single paper needs five figures at once, and the auto-refine mode keeps iterating when you give feedback.
Pros and cons
Pros
- Cut figure production from hours to minutes by describing the diagram instead of drawing it.
- Critic loop catches logic errors and inconsistencies that a one-shot image model misses.
- Reference sets keep a paper's figures visually consistent with its target venue.
- Code-driven plot path preserves exact numbers, so results figures stay data-accurate.
- Open-source implementations add CLI, Python API, and MCP access for existing workflows.
Cons
- Complex diagrams with many nodes can still show warped text or wrong connector lines, so every figure needs a manual check before submission.
- The core release is a research framework, not a polished product, so setup means cloning a repo and managing API keys yourself.
- Full automation depends on you writing a clear method description; vague input produces a vague figure.
Frequently asked questions
It turns a text description of your research method into publication-ready illustrations, covering two main types: method diagrams and statistical plots. You supply the method text and a caption, and the agent pipeline returns the finished figure.
Related content
Explore related tools, skills, and articles for paper banana.
paper banana Alternatives

Google EmbeddingGemma 2
Google DeepMind · Writing · Image · CodingGoogle EmbeddingGemma 2 is a 740M-parameter open model that turns text, code, images, audio, and video frames into vectors in one 768-dimension space, running on phones and laptops.

Tractionwave
TractionWave · Image · MarketingTractionWave is an AI attention heatmap tool for static ads. Upload a PNG or JPG and it returns predicted attention, ranked hotspots, and fixes before you spend budget.

Imejis.io
Imejis.io · Image · MarketingImejis.io is an AI design studio for agents and marketing teams. Describe an image in plain words, and it writes the copy, builds the layout, reflows it to every size, then exports a finished file.