

PaperBanana
PaperBanana · Image
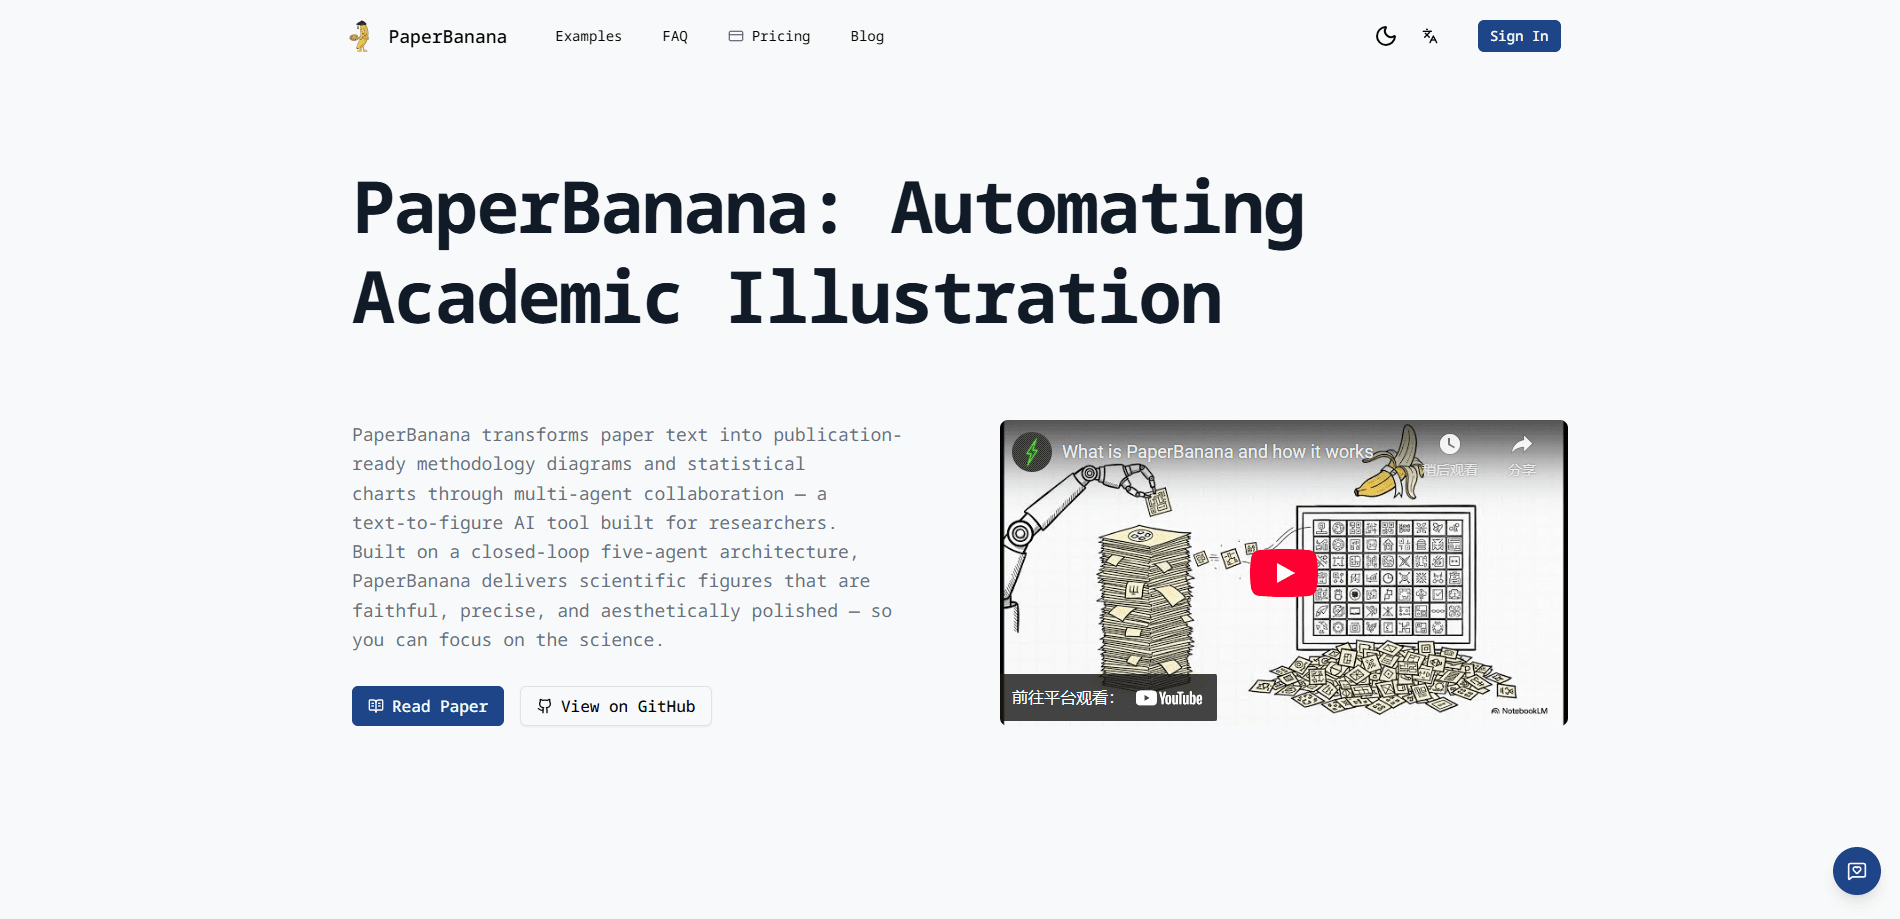
PaperBanana is an AI academic illustration generator that turns plain text descriptions into publication-ready research diagrams and statistical charts. A five-agent pipeline of retriever, planner, stylist, visualizer, and critic handles the work that used to mean hours of manual drafting in Figma or TikZ. Think of it as an AI diagram generator and scientific figure generator in one box. Researchers, grad students, and anyone writing a paper can use it to draft figures for NeurIPS, ICML, or CVPR-style submissions without learning a single piece of design software.
About PaperBanana
What Is PaperBanana
PaperBanana is a text-to-figure AI tool built for academic work. You describe the figure you need in natural language, pick a style and resolution, and the system produces a diagram or chart formatted to hold up in a paper. It came out of joint work between Peking University and Google Cloud AI Research, and it's aimed squarely at the illustration bottleneck that slows down publishing.
The tool's main selling point is the multi-agent setup. Instead of one model trying to draw everything at once, five specialized agents split the job. One finds reference examples from top-conference papers, one plans the layout from your text, and one applies academic style rules. A renderer then draws the image, and a critic checks that result against your description before it goes back for another pass. That loop is why the output tends to look closer to a human-drawn figure than a generic AI image.
The biggest limitation is precision on dense figures. Diffusion-based generation still struggles with heavy text labels and tangled connector lines, so complex architecture diagrams can come back with warped text. For numbers that must be exact, you'll want the code-driven chart path rather than pure image generation, and you should double-check every figure before it goes into a submission. It's not a magic wand. What fun is a figure that looks great but reports the wrong number?
Getting Started
- Create an account on the PaperBanana site using email, Google, or GitHub, and verify your email before you start generating anything.
- Describe the figure in the input box, then choose a style, aspect ratio, resolution (1K, 2K, or 4K), and output format.
- Generate the image. It costs credits. Standard settings run about 5 credits per image.
- Review the draft, refine your prompt or upload reference images on higher tiers, and regenerate until the figure looks right.
- Download the output as PNG or SVG and drop it into your paper or presentation without any further conversion.
Product Information
A quick look at PaperBanana's pricing, supported platforms, and performance.
Best for
The users, tasks, and scenarios where this tool fits best.
Users
- Grad students and PhD researchers
- Lab teams preparing conference submissions
- Non-designers who write papers
Tasks
- Generating research diagrams
- Building statistical charts
- Upgrading rough hand-drawn figures into cleaner academic visuals before submission.
Scenarios
- Last-minute figure prep the night before a deadline.
- Making poster assets from the same descriptions used in the paper.
- Producing consistent figures across a multi-panel paper so the style doesn't drift between sections.
Key features
Five-agent generation pipeline
PaperBanana splits figure creation across retriever, planner, stylist, visualizer, and critic agents. The retriever pulls similar examples from a library of top-conference papers, the planner turns your text into a layout spec, and the critic checks the render against your description and triggers redraws whenever something looks off. This division of labor is what separates it from a single-model image generator, and it shows in how closely the output follows your intent.
Text-to-figure from natural language
You don't need a diagramming language or a template. Type what the figure should show, and the tool picks a layout, arranges modules, and labels elements. Method diagrams, system architectures, flow charts, and statistical plots are all supported from the same input box. It works as a general statistical chart generator too.
Code-driven charts for exact numbers
For data where a wrong value ruins the paper, PaperBanana can generate and run Python visualization code instead of only imaging the chart. That path is what you want for bar charts, line plots, and anything where the numbers have to be right to the digit. No guessing. The plot reflects your actual data. That matters. Reviewers check axes.
Academic style presets
The stylist agent applies the visual conventions reviewers expect: sensible color choices, typographic hierarchy, and spacing that reads well at column width. Styles learned from papers help the output look like it belongs in the venue you're targeting rather than like a stock AI image pulled from a generic generator. It's the difference between a figure that fits the page and one that stands out for entirely the wrong reason.
Reference image and paper upload on paid tiers
Pro and Advanced plans let you upload reference images or a full paper so the tool can pull style cues automatically. If your lab has a house visual style, this keeps new figures consistent with what you've already published. No more style drift.
High-resolution export
Output goes up to 4K and comes as PNG or SVG. Vector SVG matters for print, since it scales without blurring, and you can drop the file straight into LaTeX or a slide deck. Print-ready, in other words.
Pros and cons
Pros
- Handles the whole figure pipeline, from layout to styling to review, instead of just generating an image.
- The code path for statistical charts keeps plotted values accurate, which pure image models can't promise.
- Output is aimed at publication norms, so there's less manual restyling before you submit.
- Commercial use of generated images is allowed, per the pricing page FAQ.
- Credits roll over between billing periods on subscription plans, so unused allowance isn't wasted.
Cons
- Dense architecture diagrams can come back with warped text or crossed connector lines, so you still have to inspect every figure by hand before it goes anywhere near a submission.
- Credits are consumed per generation and scale with resolution, so heavy 4K use drains an allowance faster than the yearly image counts suggest.
- It's a web tool with no confirmed public API, which means no scripting the pipeline into your own workflow.
- Refund window is tight: 24 hours and under 50 credits used, and only once per account.
Frequently asked questions
It generates finished academic figures from text. You describe a research diagram or a statistical chart, and its agents produce an image or code-driven plot ready to place in a paper. As an academic figure maker, it replaces the usual round of manual drafting.
Related content
Explore related tools, skills, and articles for PaperBanana.
PaperBanana Alternatives

Google EmbeddingGemma 2
Google DeepMind · Writing · Image · CodingGoogle EmbeddingGemma 2 is a 740M-parameter open model that turns text, code, images, audio, and video frames into vectors in one 768-dimension space, running on phones and laptops.

Tractionwave
TractionWave · Image · MarketingTractionWave is an AI attention heatmap tool for static ads. Upload a PNG or JPG and it returns predicted attention, ranked hotspots, and fixes before you spend budget.

Imejis.io
Imejis.io · Image · MarketingImejis.io is an AI design studio for agents and marketing teams. Describe an image in plain words, and it writes the copy, builds the layout, reflows it to every size, then exports a finished file.