

Piktochart
Piktochart · Image · Productivity
Piktochart is an AI design platform for building infographics, reports, presentations and social graphics. As an infographic maker and presentation maker, it turns text or data into on-brand visuals.
About Piktochart
What Is Piktochart
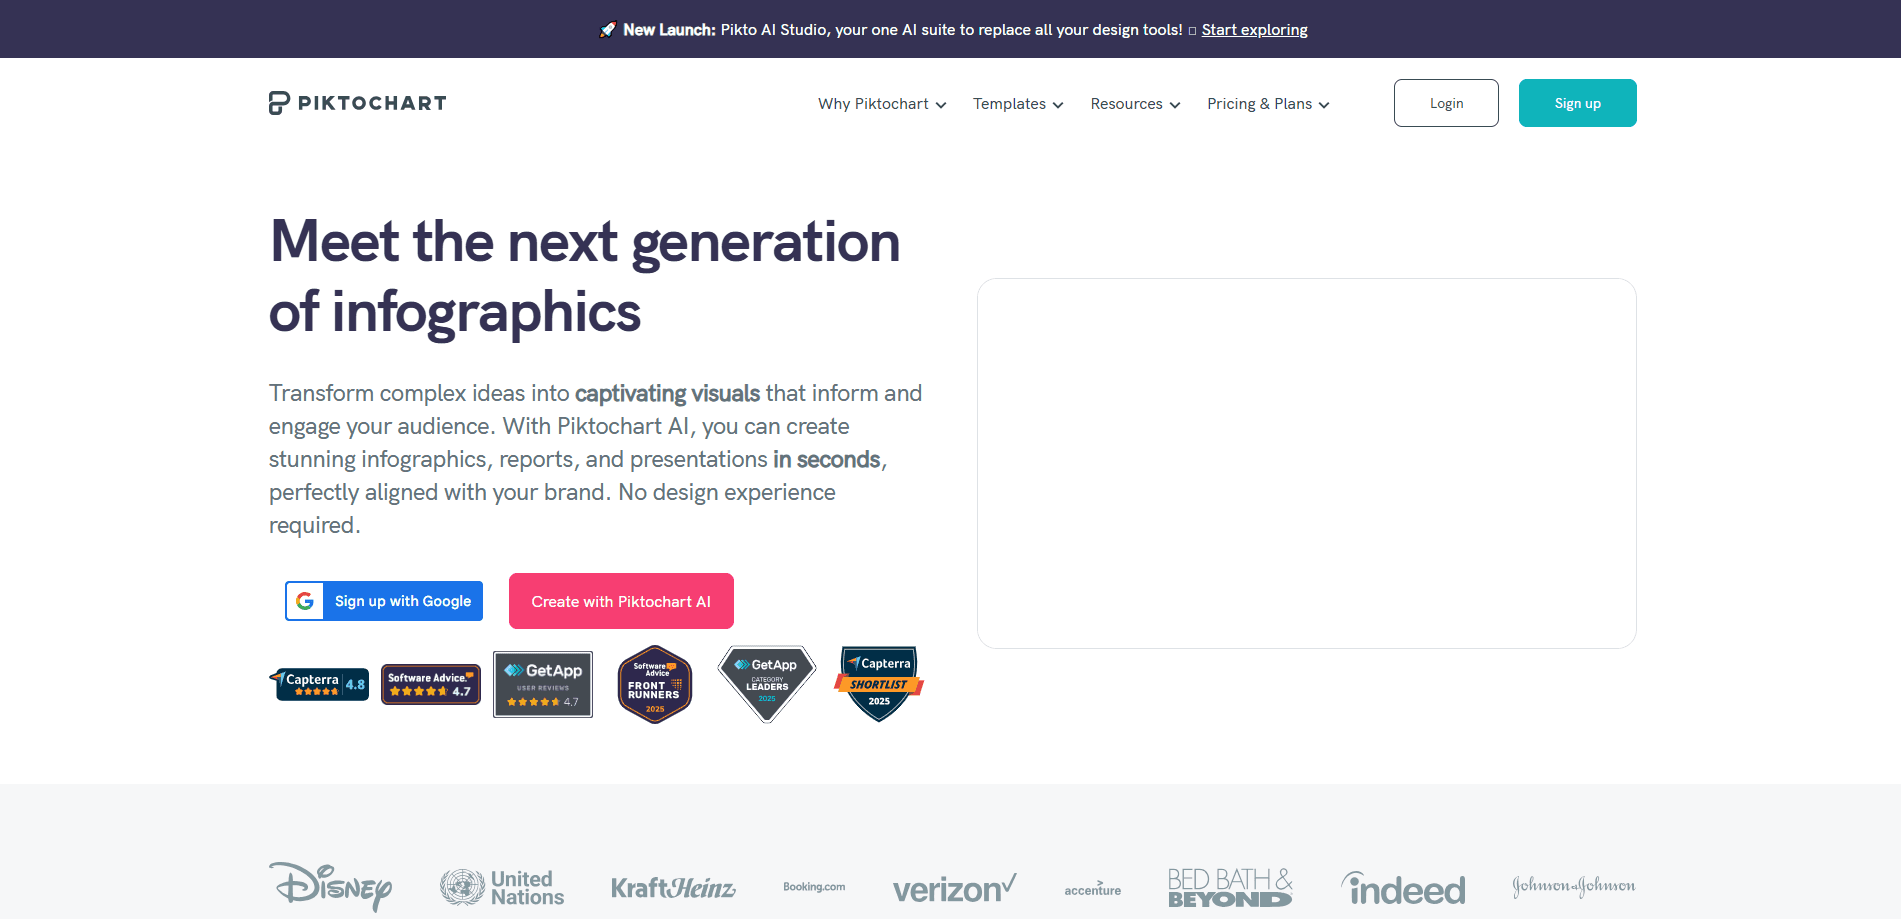
Piktochart is a browser-based visual content creator and design tool that started as a simple infographic maker and grew into a full design suite. Today the company pitches Pikto AI Studio, which takes a prompt, a document or a set of numbers and generates a finished visual in seconds. That covers infographics, reports, presentations, posters, social posts and short videos.
The product sits between Canva and a dedicated charting tool. Piktochart keeps a deep library of charts, diagrams, maps and flowcharts, which is why data-heavy teams reach for it. Marketing, HR and consulting teams use it to turn dense findings into something a room can read at a glance. The AI layer is the newer half of that pitch, and it handles the blank-page problem for people who never trained as designers.
Two limits matter up front. The free plan lets you build visuals but the download and AI credit rules push most regular users toward a paid seat. And because it generates polished templates fast, the risk of every team output looking the same is real unless you lean on the branding tools.
Getting Started
- Sign up for a free account and pick a format, such as an infographic, report or presentation
- Type a prompt or import a document and let the AI draft a first version, or start from a template
- Edit the layout, swap in your own data, charts and brand colors, fonts and logo
- Download as PNG, PDF or PPT, or share a live link with your team
Product Information
A quick look at Piktochart's pricing, supported platforms, and performance.
Best for
The users, tasks, and scenarios where this tool fits best.
Users
- Marketers
- HR and internal comms staff
- Consultants and analysts
- Educators and students
Tasks
- Infographic creation
- Report and document design
- Presentation building
- Data visualization
- Video and social content
Scenarios
- A quarterly report lands the day before a board meeting
- A solo marketer owns every channel
- A university team runs orientation
- A startup needs a pitch deck on a tight budget
Key features
Pikto AI Studio
Pikto AI Studio, the platform's AI infographic maker, is the hub that ties the generators together. You drop in a prompt, a document or a data set and it proposes a full design, then you refine it in the editor. The company's line is that you skip the blank page and start from something finished. For teams without a designer, that gap between an empty canvas and a usable draft is the whole point.
Text-to-Visual Generator
The core generator turns written input into a laid-out visual, and it doubles as an infographic generator for anyone who'd rather not start from a template. You type what you need and it picks a structure, a color scheme and icons to match. It handles formats from infographics to flyers and posters, and the output lands in the editor so you can keep editing rather than being stuck with a static file. This is the feature that replaces a template hunt and an afternoon of manual layout.
Charts, Maps and Diagrams
Piktochart keeps a library of charts, graphs, pictographs, maps, timelines and flowcharts, and you can build and customize them from your own data. That breadth is the reason analysts pick it over a plain graphic tool. If your work lives in spreadsheets, this is where the tool earns its keep.
Brand Assets and Branded Templates
Brand Assets stores your fonts, colors and logos in one place, and Branded Templates rebuilds the library in your style. Instead of recoloring each graphic by hand, you get brand-consistent starting points. This matters most for teams, where keeping twenty people on the same visual identity by hand doesn't scale.
Team Collaboration
The workspace supports shared editing, comments and shared brand assets, so several people can work on one visual. Business and Enterprise tiers add more seats and controls. For teams that review visuals before they ship, this removes the export-email-reedit loop.
AI Image and Video Tools
Beyond static design, Piktochart bundles an image generator, background and object removers, an upscaler and a restorer, plus a video editor for repurposing clips. The video side can produce several aspect ratios from one setting for platforms like YouTube and TikTok. It's a wide net, and the image tools are more mature than the video ones.
Pros and cons
Pros
- Strong chart, map and diagram library makes it a fit for data-heavy visuals, not just pretty graphics
- AI generation turns a prompt or document into a usable draft in seconds, which cuts the blank-page problem
- Free plan lets you build and try the editor before paying for downloads
- Brand Assets and Branded Templates keep team output consistent without manual recoloring
- Exports to PNG, PDF and PPT, so visuals drop straight into the tools people already use
Cons
- The free plan restricts downloads and AI credits, so regular users end up on a paid seat
- Video editing is a newer addition and less developed than the image and design features
- No public API means teams that want to generate visuals at scale have to do it by hand
- Rich template libraries push people toward similar looks, so you need the branding tools to stand out
Frequently asked questions
Piktochart builds visual content: infographics, reports, presentations, posters, social graphics and short videos. Its draw is combining a deep chart and diagram library with AI generation, so you can turn text or data into a finished, on-brand visual without design training.
Related content
Explore related tools, skills, and articles for Piktochart.
Piktochart Alternatives

Google EmbeddingGemma 2
Google DeepMind · Writing · Image · CodingGoogle EmbeddingGemma 2 is a 740M-parameter open model that turns text, code, images, audio, and video frames into vectors in one 768-dimension space, running on phones and laptops.

Tractionwave
TractionWave · Image · MarketingTractionWave is an AI attention heatmap tool for static ads. Upload a PNG or JPG and it returns predicted attention, ranked hotspots, and fixes before you spend budget.

Imejis.io
Imejis.io · Image · MarketingImejis.io is an AI design studio for agents and marketing teams. Describe an image in plain words, and it writes the copy, builds the layout, reflows it to every size, then exports a finished file.