

R0Y
R0Y · Business · Chatbot
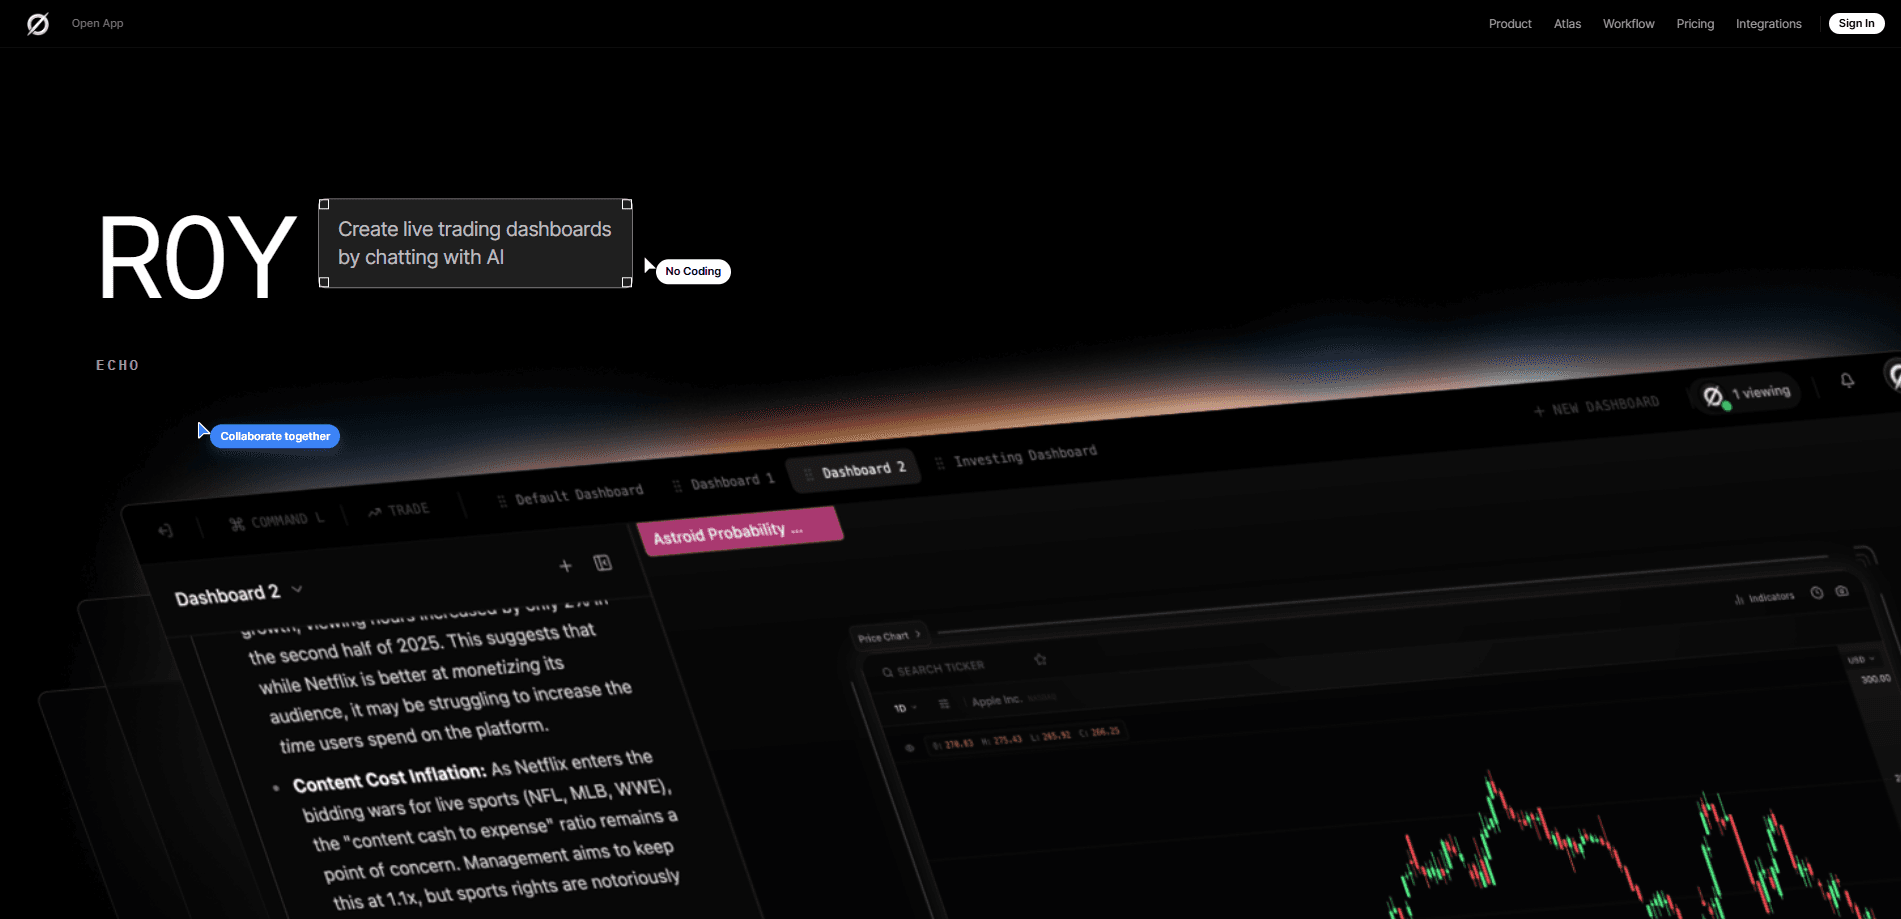
R0Y is a browser-based AI financial dashboard that builds custom charts and market views from plain-language prompts instead of manual spreadsheet work. Traders, investors and students describe what they want to see, and R0Y turns that description into a visual it renders in the app. It runs in a web browser and as a desktop client, which keeps the same workspace available on a laptop or a lab computer.
About R0Y
What Is R0Y
R0Y is a financial dashboard built around natural language. Instead of clicking through a chart builder and picking timeframes, tickers and indicators one by one, you type what you want and R0Y generates the visualization. That's the whole pitch: fewer menus, faster chart setup.
Most retail charting tools assume you already know where every setting lives. R0Y assumes you'd rather describe the question. If you've ever lost ten minutes hunting for the right indicator panel, the difference lands fast. Not everyone wants that trade. R0Y also gives up some of the fine-grained control that manual builders offer, since the model decides how to read your request.
The product runs at r0y.xyz and also ships as a desktop shell. There's a separate students area, which points to coursework and study use alongside retail trading. Details on live data feeds and broker connections are thin, so treat those as unconfirmed until you see them in your own account.
Getting Started
- Open r0y.xyz in a browser and create an account.
- Sign in to reach the main dashboard workspace.
- Describe the chart you want in plain language, naming the market and the metric you care about.
- Adjust or rephrase the prompt if the first render misses what you meant.
- Save the view in your workspace, or install the desktop app if you'd rather work offline from the browser.
Product Information
A quick look at R0Y's pricing, supported platforms, and performance.
Best for
The users, tasks, and scenarios where this tool fits best.
Users
- Retail traders who want to sketch a market view in seconds rather than configure a chart from scratch, provided the natural-language render matches their intent.
- Students and learners studying markets, since the students area and prompt-based charting lower the setup cost for coursework. No manual builder, no setup slog.
- Analysts and researchers who build many one-off visuals and would rather describe them than rebuild the same layout each time.
Tasks
- Generating custom charts from a written prompt instead of a manual builder.
- Turning a market question into a visualization you can review and refine.
- Prototyping several chart ideas quickly before committing to a full analysis.
- Keeping a personal dashboard of saved views in one workspace.
Scenarios
- A quick pre-market check when you want a chart in under a minute.
- Classroom or self-study sessions where you're exploring how a metric behaves.
- Early-stage research, when you're comparing a handful of possible angles on the same market.
Key features
Prompt-Based Chart Generation
The core of R0Y is turning a written request into a chart. You name the market, the metric and the timeframe in plain language, and the dashboard renders a matching visualization. It's a real AI chart generator, not a template picker. That removes most of the clicking that usually goes into setting up a custom chart. Vague prompt? Vague chart.
Custom Visualization Views
Beyond single charts, R0Y lets you arrange and save views in a dashboard workspace. The financial data visualization side is the point here. One question tends to lead to another, and keeping related visuals together beats rebuilding them every session.
Natural Language as the Interface
Because the interface is conversation-driven, the learning curve is mostly about how you phrase requests. You don't need to memorize menu locations or indicator names. The trade-off is that vague prompts produce vague charts, so specificity pays off. Say what you mean. The dashboard does the rest.
Web and Desktop Access
R0Y runs in a browser and also installs as a desktop app. Work on a laptop at home. Pick it up on a machine at school. You're not starting over, since the same account carries your workspace across both.
A Separate Students Workspace
R0Y includes a students area alongside the main dashboard. It points to learning and coursework as a real use case, not just retail trading, which sets it apart from tools aimed only at active traders.
Pros and cons
Pros
- Builds charts from plain-language prompts, which cuts setup time for one-off visuals.
- Saves you from memorizing indicator menus and ticker syntax just to draw a chart.
- Works in a browser and as a desktop app, so you're not tied to one machine.
- A dedicated students area makes it usable for coursework, not only trading.
- Saved dashboard views keep related charts together across sessions.
- A free plan makes it easy to test whether prompt-based charting fits how you work.
Cons
- Relying on prompts means you have less fine control than a traditional chart builder gives you, which matters a lot if your workflow depends on exact indicator settings rather than approximate views.
- Confirmed details on data feeds and broker integrations are limited, so you can't assume live institutional data or trade execution.
- No Google Play listing, so there's no Android app to install alongside the web and desktop versions.
Frequently asked questions
R0Y is an AI financial dashboard that generates custom charts and visualizations from natural language descriptions. You type what you want to see, and it renders a matching chart rather than making you configure one manually.
Related content
Explore related tools, skills, and articles for R0Y.
R0Y Alternatives
Liveplan
Palo Alto Software · BusinessLivePlan is business plan software that helps founders and small business owners turn an idea into a funder-ready plan. It combines AI-assisted writing, market research with cited sources, and connected financial forecasting so your income statement, cash flow, and balance sheet move together when you change one number. Over 1.5 million businesses have used it to plan, forecast, and track performance against real accounting data. That's a lot of founders. It's also a signal the tooling survived contact with real lenders.

Swms
Swms AI · Writing · Productivity · BusinessSwms is an AI safety compliance tool that turns a plain description of a job into ready-to-use safety documents. Describe your project, trade, and known hazards, and it writes a safe work method statement, job hazard analysis, safe work procedure, RAMS, or safety data sheet in seconds. It also ships with Oscar, a chat assistant that answers workplace safety questions in any language. Teams in construction, mining, transport, and warehousing use it to cut the paperwork that usually eats into a workday.

Rows
Rows (Superhuman) · Productivity · BusinessRows is an AI spreadsheet and data analysis tool that imports live data from more than 50 sources, then lets you work with it using plain language instead of SQL queries or nested formulas. You can pull numbers out of PDFs, connect ad platforms, databases, and bank accounts, and ask the AI to build reports, merge datasets, or set up models that recalculate themselves. It runs in the browser, works like a spreadsheet, and now sits under the Superhuman umbrella.