

Screenful
Screenful Oy · Productivity
Screenful is a project analytics and reporting platform that turns task data from Jira, Trello, Asana, monday.com, and other tools into agile charts and scheduled reports.
About Screenful
What Is Screenful
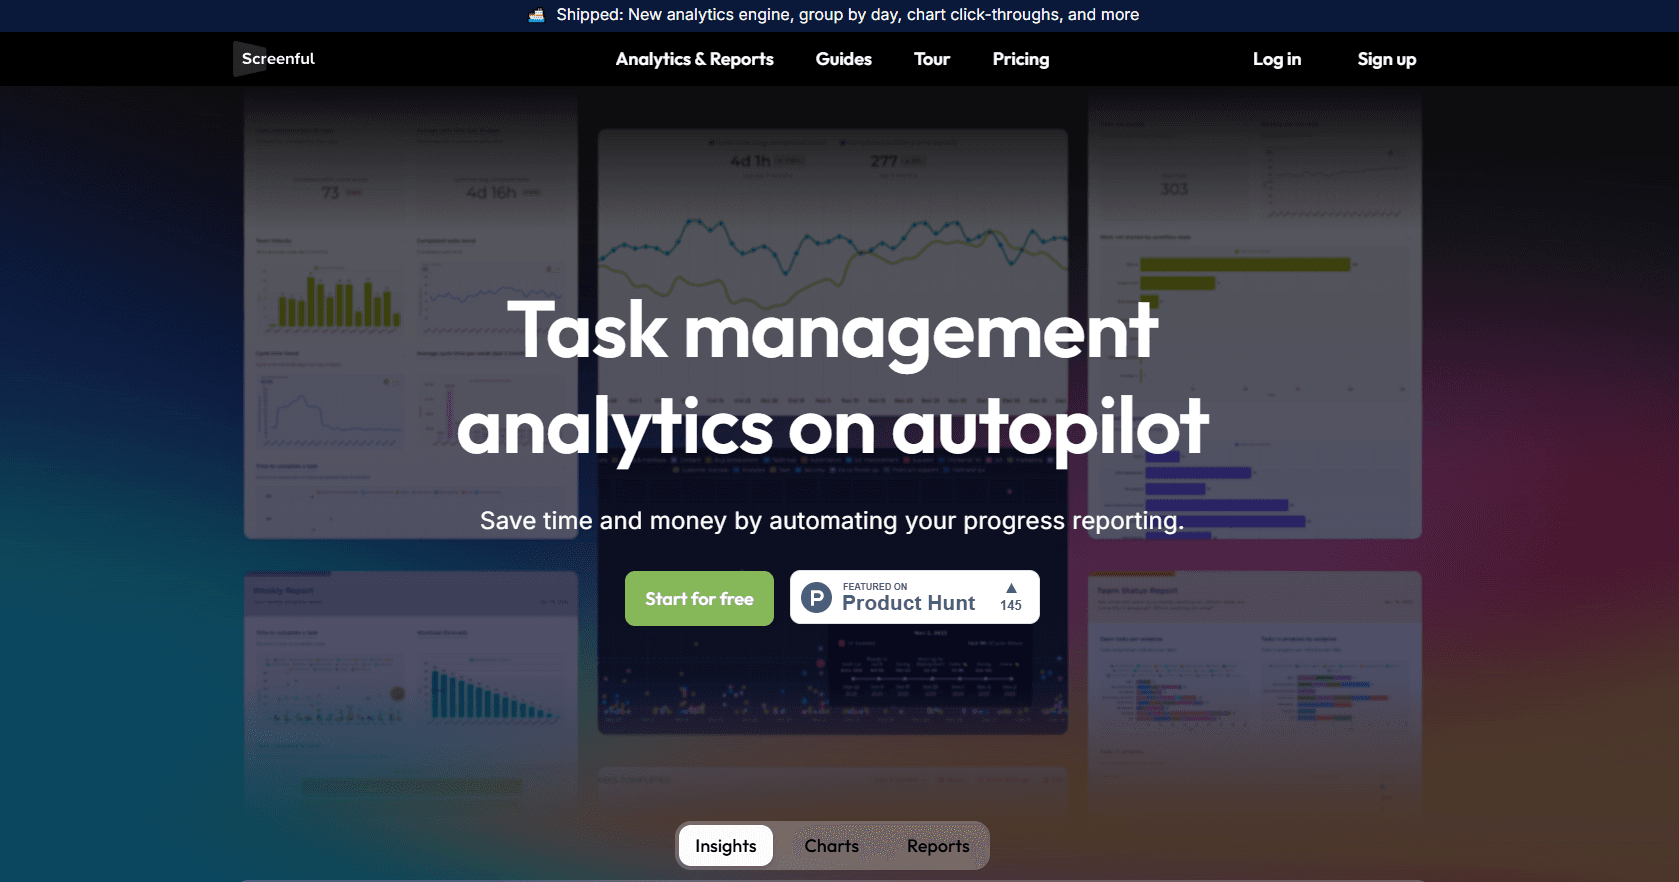
Screenful connects to the boards and projects you already work in, then turns that task data into charts and reports you'd otherwise build by hand. It reads from tools like Jira, Trello, Asana, monday.com, Linear, GitHub, GitLab, ClickUp, and Teamwork, so you don't have to export spreadsheets or wire up a separate data pipeline.
The product targets teams that run on visual boards but never measure how the work actually flows. This agile reporting tool tracks velocity, throughput, lead time, and cycle time, then lets you drop those metrics into shareable reports. An AI assistant builds charts from plain-language prompts, and you can still shape everything by hand in the chart editor.
The main limits are scope and cost. This is reporting only, so it won't change anything inside your tools. Pricing scales with the number of data sources you import rather than seats, which suits larger teams but can add up for small shops tracking many boards.
Getting Started
- Sign up at the Screenful web app and start the 14-day free trial, which doesn't ask for a card.
- Connect a data source by authorizing access to a board, project, or team from a supported tool.
- Pick one of the 150+ chart templates or describe the chart you want to the AI assistant.
- Tailor the chart in the editor, adjusting metrics, filters, grouping, and date range.
- Combine charts into a report, then share it by link or schedule it through email or Slack.
Product Information
A quick look at Screenful's pricing, supported platforms, and performance.
Best for
The users, tasks, and scenarios where this tool fits best.
Users
- Scrum masters and agile coaches
- Engineering managers
- Executives and stakeholders who want a quick status view
Tasks
- Tracking velocity and throughput
- Watching lead and cycle time
- Automating recurring summaries
Scenarios
- Sprint reviews and retrospectives
- Reporting up to leadership
- Comparing several boards at once
Key features
Multi-Tool Data Integrations
Screenful pulls task data from Jira, Trello, Asana, monday.com, Linear, GitHub, GitLab, ClickUp, and Teamwork, and you can mix sources from different tools in the same account. That means a team split across two systems still lands in one set of charts.
Drag-and-Drop Chart Builder
You build charts by dragging fields into place, with 150+ templates to start from. Built-in velocity charts, throughput views, and cumulative flow diagrams cover the common cases, and the editor lets you fine-tune metrics, filters, grouping, and date ranges when a template isn't quite right.
AI Assistant for Charts
The AI assistant creates charts from a prompt in plain language, including your native language. It answers questions about your data and links back to the human-written guides behind its answers. Screenful says the assistant only picks the chart configuration, so the numbers still come from your actual data rather than being generated.
Scheduled and Shareable Reports
Reports bundle up to 12 charts with text commentary, then go out by link, email, or Slack on a daily, weekly, or monthly schedule. You can also embed charts in tools like Notion, which helps when outside stakeholders need visibility without an account.
Private Charts and Access Control
From the Scale plan up, charts and reports can be kept private rather than shared openly. Enterprise adds single sign-on, per-user access control, and the option to limit visibility by source, which matters once data from different projects should stay separate.
Pros and cons
Pros
- Unlimited users on every plan, so you pay for data sources instead of seats.
- Connects to nine project tools, letting mixed stacks share one reporting layer.
- Ready-made templates for velocity, throughput, lead time, and cycle time cut setup time.
- Scheduled email and Slack reports keep stakeholders current without manual updates.
- The AI assistant turns a plain prompt into a working chart, then leaves it editable.
Cons
- Reporting only, so it never changes anything inside your project tools.
- Pricing starts at $39 a month and climbs with each data source, which gets steep for small teams tracking many boards.
- There's no free plan, only a 14-day trial that deletes the account 30 days after it ends if you don't upgrade.
- No public API to build on and no native mobile app, so everything runs through the browser.
Frequently asked questions
Screenful turns task data from tools like Jira, Trello, and Asana into agile charts and reports. Teams use it to track velocity, throughput, lead time, and cycle time, then share the results through links, email, or Slack.
Related content
Explore related tools, skills, and articles for Screenful.
Screenful Alternatives

Udon
Udon · Coding · ProductivityUdon turns an Apple Silicon Mac into a home server you run from a browser, with container controls, file shares, and an optional AI sysadmin.

offstage
offstage cloud · Coding · Productivityoffstage gives AI coding agents and CI jobs a real Mac: a fresh macOS account on Apple silicon, driven over an API and billed by the second.

BotBus
Chengdu Tuyang Tusen Technology Co., Ltd. · Coding · ProductivityBotBus lets you control AI coding agents from your phone and watch: approve commands, start tasks and read results while the code stays on your desktop.