

TestDino
TestDino · Coding
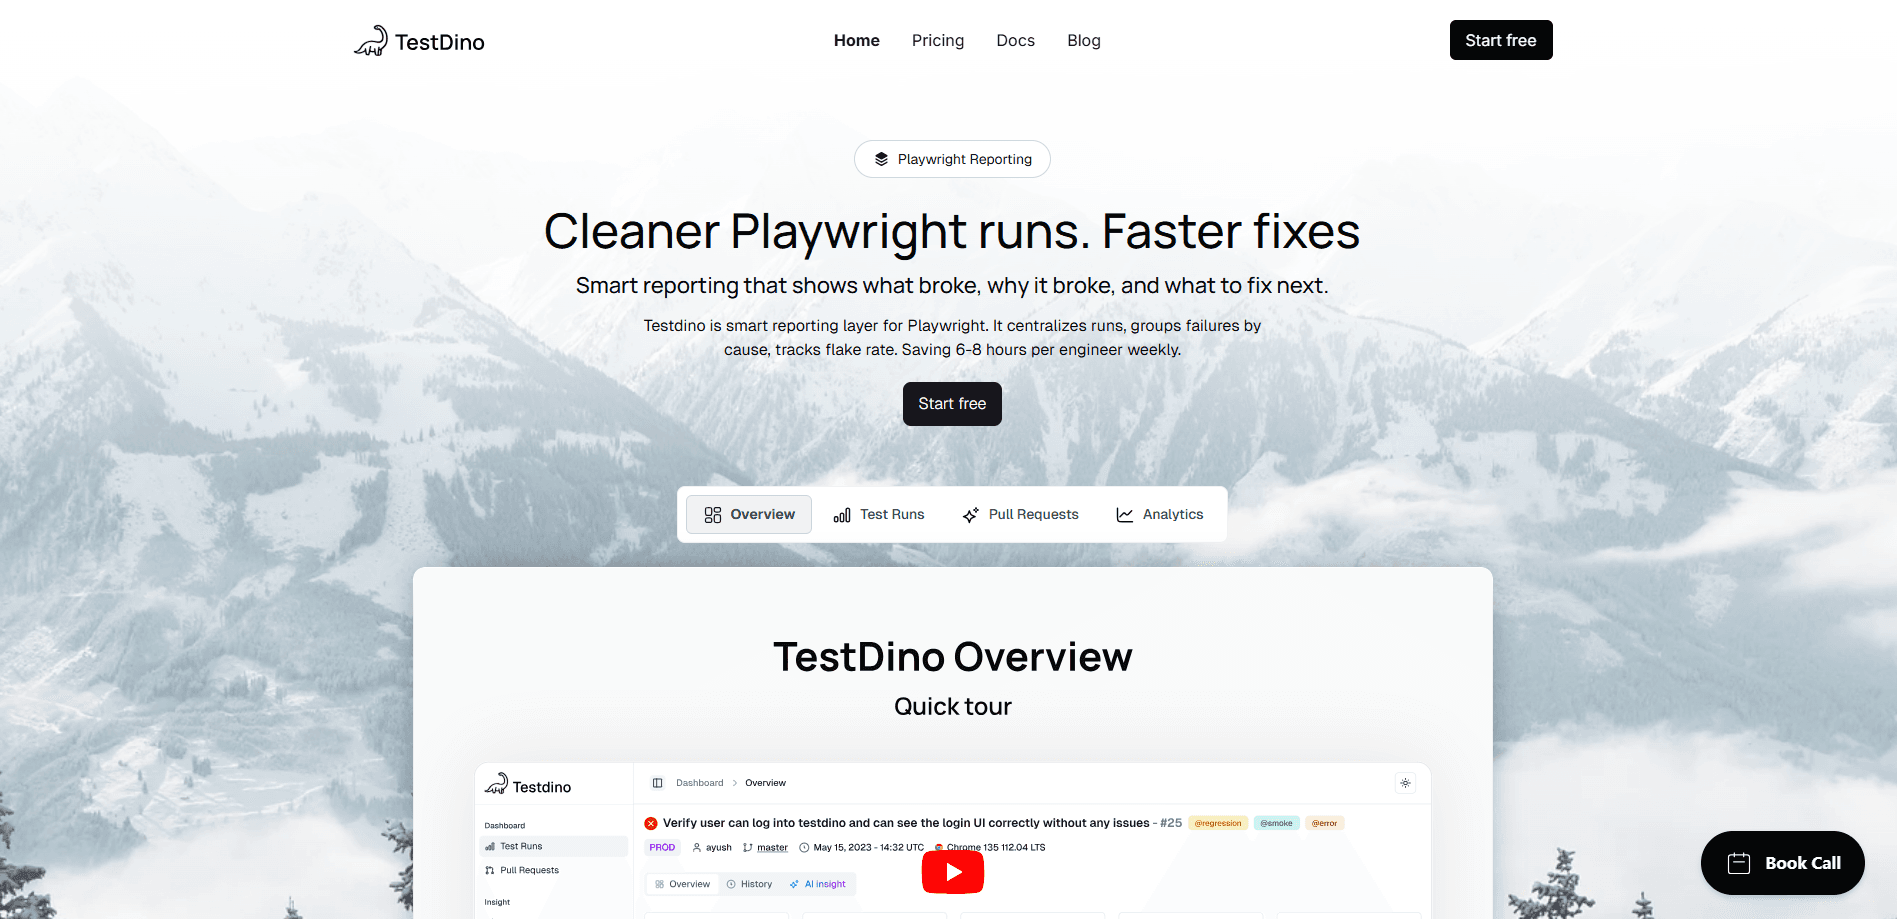
TestDino is a cloud companion for Playwright that records CI test runs, groups failures, and flags flaky tests, then exposes the data to teams and AI agents.
About TestDino
What Is TestDino
TestDino is a web app that sits next to Playwright, the popular open source browser testing framework. You install its reporter in your project, and every run in your pipeline streams results live to a central dashboard. Instead of scrolling through raw CI output, you get a structured view of what passed, what failed, and why.
The product targets a specific pain: teams that run large Playwright suites in CI usually shard tests across several machines, which makes the final picture hard to assemble. TestDino pulls those shards into one report and adds history on top, so a failure that keeps returning shows up as a pattern rather than a single red mark.
The main limits are scope and setup. TestDino only works with Playwright, so Cypress or Selenium shops get nothing from it, and the core value comes from wiring it into CI rather than running tests on your laptop. The free plan also caps you at 5,000 monthly executions and a single user, which fits personal projects but not a full QA team.
Getting Started
- Create an account at app.testdino.com and generate a project API key.
- Install the package with
npm install @testdino/playwright. - Register the reporter in
playwright.config.tsand pointtokenat your API key. - Run
npx playwright test, or push to your CI provider, and watch results stream into the dashboard.
Product Information
A quick look at TestDino's pricing, supported platforms, and performance.
Best for
The users, tasks, and scenarios where this tool fits best.
Users
- QA and automation engineers running Playwright in CI
- Small QA teams on a budget
- Engineering leads tracking suite health
Tasks
- Triaging a failed CI run
- Finding and quarantining flaky tests
- Enforcing a quality gate on pull requests
- Feeding test data to an AI agent
Scenarios
- A nightly suite that shards across five workers
- A suite inherited from another team with little documentation
- A release where a red pipeline blocks everyone
Key features
Real-Time Test Streaming
Results arrive as tests run rather than after the full build finishes, so a long suite no longer hides its state until the end. Each run opens with a multi-tab report covering summary, spec breakdown, error groups, run history, and configuration metadata. The point is speed: understanding a failed run in minutes instead of after a manual merge.
Flaky Test Detection
Every test carries a stability percentage and a root cause category pulled from timing, environment, network, assertion, or other signals. You see which tests are unreliable and why, not just that something turned red again. Teams can then quarantine the worst offenders and rerun only the failed tests rather than the whole suite.
Failure Grouping and Trace Viewer
The platform automatically groups failures that share a cause, so you work through patterns instead of individual test names. A one-click trace viewer opens straight from the grouping, with screenshots, video, and visual diffs attached. That combination replaces the usual hunt through downloaded CI artifacts.
Test Analytics and Trends
A single dashboard offers six views: suite summary, run timing, individual test trends, error categorization, coverage metrics, and environment pass rates. Everything filters by branch, tag, or time period, which makes it practical to compare a feature branch against main. Coverage tracking closes the loop by showing what your suite actually exercises.
CI/CD and PR Quality Gates
The reporter plugs into GitHub Actions, GitLab CI, CircleCI, Jenkins, Azure DevOps, and more, with dedicated setup guides for each. You can set pass rate or flaky thresholds that post a status check on pull requests, so a branch that misses your bar stays blocked. Results also link back to commit hashes and PRs for traceability.
AI Analysis and MCP Server
Paid plans add AI test analysis, spanning failure classification, AI-generated fix suggestions, and pattern recognition across runs. The MCP server and REST API expose all of this to AI agents, so an assistant in Cursor or a similar editor can query a run and propose a fix in context. It's the feature that separates TestDino from a plain Playwright reporting dashboard.
Pros and cons
Pros
- Live streaming shows sharded run progress as it happens, so you don't wait for a final merged report.
- Flaky test detection pairs a stability score with a root cause category, which turns vague reruns into targeted fixes.
- The free plan covers 5,000 executions a month, enough to evaluate the workflow without a card.
- The MCP server and REST API make results queryable by AI agents, fitting teams that debug inside an IDE.
- Integrations span GitHub, GitLab, Jira, Slack, Linear, and more, so alerts land where the team already works.
Cons
- It only supports Playwright, so teams on Cypress, Selenium, or WebdriverIO can't use it at all.
- Most of the value depends on CI integration, meaning local-only test runs show far less benefit.
- The free plan caps you at one user and 5,000 executions a month, which rules out anything beyond a solo workflow.
- Advanced capabilities like AI test audit sit in the Team plan at $79/mo, so smaller teams may find the useful tier a jump in price.
Frequently asked questions
TestDino records Playwright test runs from CI and turns them into a central dashboard with failure grouping, flaky test detection, and analytics. It's aimed at teams that run large browser test suites and need a faster way to see what broke and why.
Related content
Explore related tools, skills, and articles for TestDino.
TestDino Alternatives

Udon
Udon · Coding · ProductivityUdon turns an Apple Silicon Mac into a home server you run from a browser, with container controls, file shares, and an optional AI sysadmin.

offstage
offstage cloud · Coding · Productivityoffstage gives AI coding agents and CI jobs a real Mac: a fresh macOS account on Apple silicon, driven over an API and billed by the second.

BotBus
Chengdu Tuyang Tusen Technology Co., Ltd. · Coding · ProductivityBotBus lets you control AI coding agents from your phone and watch: approve commands, start tasks and read results while the code stays on your desktop.