
TraceLLM
TraceLLM · Coding
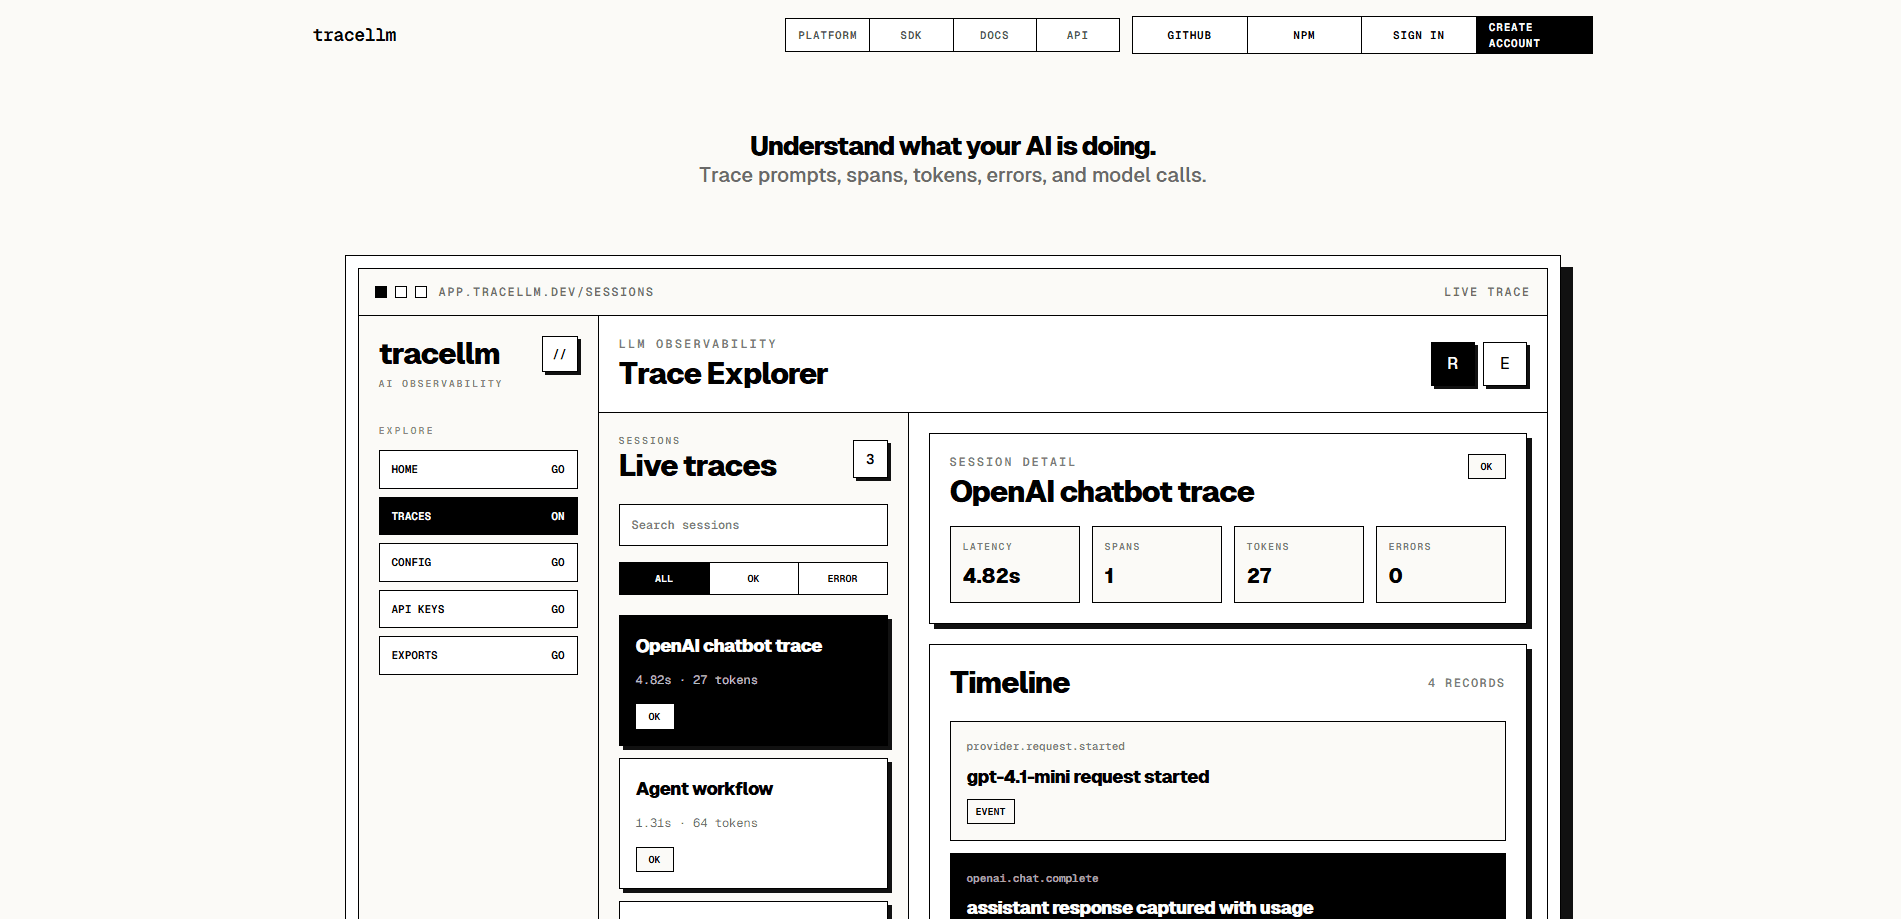
TraceLLM is a local-first LLM observability platform for teams running AI applications in production. It records sessions, spans, prompts and outputs (when you allow it), token usage, latency, and errors across chatbots, agents, and RAG pipelines, then shows everything on one trace timeline. A policy layer decides what gets captured, redacted, or dropped, and an OpenTelemetry export path forwards selected traces to backends like SigNoz or Honeycomb. So what does that buy you? A single place to answer why one answer went wrong.
About TraceLLM
What Is TraceLLM
TraceLLM is an observability platform built specifically for AI applications. Instead of scattering clues across provider dashboards, app logs, and user bug reports, it gives each AI workflow a single trace timeline: what triggered it, which model call ran, how long each step took, how many tokens it burned, and where it failed.
The project is open source under the MIT license, with the code on GitHub and the hosted app at tracellm.in. It grew out of a common problem: a wrong answer shows up in production, yet the app code, the vector store, and the model provider each hold only fragments of the story. TraceLLM stitches those fragments back into one inspectable record.
The main limit is maturity. TraceLLM is young. The Node SDK is a workspace package rather than a published npm release, and the docs still point to a local quickstart for setup. If you need a battle-tested tool with a big integration gallery today, this isn't that yet. If you want to read the code and self-host it, it's a clean fit.
Getting Started
- Create an account at tracellm.in, or run the stack locally with
pnpm install,pnpm infra:build, andpnpm infra:up. - Create a project and copy the project-scoped API key (
trllm_...). - Install the Node SDK in your app and start a session with your endpoint, API key, and service name.
- Wrap your model calls in spans, then record events, token counts, and errors as you go.
- Open the Trace Explorer to inspect each session, and optionally add an OTLP endpoint to forward traces to your own backend.
Product Information
A quick look at TraceLLM's pricing, supported platforms, and performance.
Best for
The users, tasks, and scenarios where this tool fits best.
Users
- AI engineers and backend developers
- Small product teams without a platform budget
- Debugging-focused support staff
Tasks
- Tracing a bad chatbot answer
- Watching token spend
- Keeping errors attached to real sessions
- Exporting to an existing APM
Scenarios
- Shipping an agent to production and needing a way to replay a failing conversation
- Working under content rules where prompts contain personal data
- Standardizing observability across several AI services
Key features
Session and Span Tracing
TraceLLM organizes an AI workflow as a session with nested spans. A session holds the user turn. Each span covers one unit of work, such as a provider call, a retrieval step, or a tool run. That's the core of LLM tracing. You start a session, open spans inside it, record events as they happen, and close both with a status. The structure turns a loose pile of log lines into one replayable run.
Capture Policy Controls
Not everything should be stored. You set the policy per project: whether prompt and output content is captured, how much metadata and usage is kept, and whether redaction masks API keys and bearer tokens before they hit the database. This is where prompt tracing gets its guardrails. Sampling can capture 0% to 100% of sessions, and specific span kinds can be skipped entirely.
Token Usage and Latency Tracking
Each span can carry token counts and timing alongside its attributes. Cost and speed sit in the same view as the call itself. You can see which step is slow and which one is expensive. No joining two dashboards. That's the difference between knowing the bill went up and knowing which prompt caused it.
OpenTelemetry and OTLP Export
TraceLLM keeps its own product timeline and can forward selected traces to a customer-owned OTLP HTTP collector. You paste in an endpoint, choose which signals to forward, and the data flows to SigNoz, Honeycomb, Tempo, Datadog, or any OTLP-compatible backend. Teams already running an APM can keep their existing stack and treat TraceLLM as the AI-specific layer on top.
Provider-Agnostic Instrumentation
Think of it as an AI debugging tool that doesn't lock you to one vendor. The spans don't care which model you call. TraceLLM works with OpenAI, Claude, Gemini, custom routers, internal services, and MCP-shaped workflows, because you wrap the call yourself rather than relying on a provider-specific plugin. Swapping models or gateways doesn't break your tracing setup.
Project-Scoped API Keys
Each API key maps requests to one project and carries that project's capture policy into the SDK runtime. Create several keys. Name them. Revoke old ones when a service stops using them. That keeps a shared policy from leaking across unrelated apps, and it makes key rotation a simple two-step job.
Pros and cons
Pros
- MIT-licensed and open source, so there's no subscription and the code is readable.
- Local-first design lets you self-host and keep trace data on your own infrastructure.
- Capture policy separates content, metadata, usage, and errors, which helps with sensitive prompts.
- OTLP export means you don't abandon an existing SigNoz or Datadog setup.
- Provider-agnostic spans cover OpenAI, Claude, Gemini, and custom gateways without plugins.
Cons
- The Node SDK isn't published to npm yet, so early adopters install it from the repo or a workspace package.
- It's a young project, so expect fewer prebuilt integrations and community examples than mature tools offer.
- Self-hosting means you handle deployment, upgrades, and storage sizing yourself.
- The docs are still filling out, so some setup steps need reading the source.
Frequently asked questions
TraceLLM is used to debug and monitor AI applications in production. It records sessions, spans, token usage, latency, and errors for chatbots, agents, and RAG pipelines, then shows them on one timeline so you can find why a specific answer went wrong.
Related content
Explore related tools, skills, and articles for TraceLLM.
TraceLLM Alternatives
Forefront
Forefront · CodingForefront is a web platform for building with open-source AI. It lets you fine-tune leading open-source language models on your own data, evaluate how they perform, and run them through an API or export them to host yourself. Developers who want the convenience of a closed-source platform but insist on owning their models and data are the target audience here.

Startkit
StartKit.AI · CodingStartkit is a boilerplate for building AI SaaS and AI wrapper products. Think of it as an AI startup boilerplate with the boring parts already wired up: authentication, Stripe and Lemon Squeezy payments, usage limits, transactional email, and an AI API starter that talks to OpenAI, Anthropic, Groq, or Llama. You clone the repo, set your price, and start on the part of your product that people actually pay for. It's Next.js under React and Tailwind, so most of the boilerplate code already feels familiar.
Testim
Tricentis · CodingTestim is an AI-powered test automation platform for building and running end-to-end tests across web, mobile, and Salesforce applications. It leans on machine learning to keep tests stable when an interface changes, so teams spend less time fixing broken selectors. Not bad for an automated testing tool you can start using today. You create tests by recording actions in a browser, then optionally add JavaScript when you need more control. It's a solid pick for busy QA teams.